Are equity markets overheated? Is it time to book profits or is it actually a good time to invest given the exuberance? These may be just some of the questions running through the minds of investors. This article delves into various factors to assess whether the stock market is indeed over-valued, what could go wrong with markets at rich valuations and what investors can do to protect their wealth.
What moved the markets?
Before getting into factors that should alert you on whether the market is overheated, let us briefly see what led to the rally, first. what made the markets rally so much before the underlying economic recovery? Market rallies, broadly speaking, are led by three major factors: liquidity, interest rates and earnings.
Now, all of these factors have been in play to some extent to raise the market to unprecedented levels. Just to explain briefly, the pandemic resulted in a fresh round of huge stimulus measures from advanced economies (>$10 trillion) across the globe. High liquidity meant low rates but then high inflation.
Still Federal Banks across the world held their rates to help their respective economies bounce back from the pandemic. That meant a prolonged phase of high liquidity and low interest rate. As for earnings, while the bounce back from the Pandemic caused a sharp increase in earnings for large players, a recovery in industrial and agricultural commodities after a lull for a few years, also acted big time in favour of strong earnings growth for India Inc.
So with all the three factors – liquidity, interest rates and earnings – at play, stock markets globally have gone far ahead of real economic recovery.

What factors suggest overheating?
So we know now that the market did not move without reason. There was money. And money was cheap. It has to be deployed where it would earn better than the low interest that banks and bonds offered. They chased equity and rode the market. Good. But how much is too much? Let’s now look at fundamental indicators and market actions that generally alert you to overheated markets.
#1 Valuation
There is a price you pay for everything to ensure you gain something out of it. Valuation metrics can help decide how much that gain can be from stocks. Typically, valuation is a slave of both earnings and interest rates.
Below, is a table on price earnings (PE) and Price to book value (P/BV) ratios at various index levels (peaks and troughs) for the Nifty 50 index.
Most of the peaks, barring Feb 2020, had one characteristic in common, a strong market rally developing into euphoria. The triggers for correction, of course, were different for each. While the rally in calendar year 2007 was one such - riding on infrastructure and real estate- the one in 2010 was led by banks, especially PSU banks. It marked the peak for PSU banks followed by a decade of significant wealth erosion (triggered by high NPAs) while the Nifty corrected ~30%.
The rally in 2015, post a change of government, also developed into an euphoric market. The depth of correction that followed (~25%) took investors by surprise at that time. The peak in 2018 was led by a euphoric rally in mid and small caps that followed with a 40% correction.
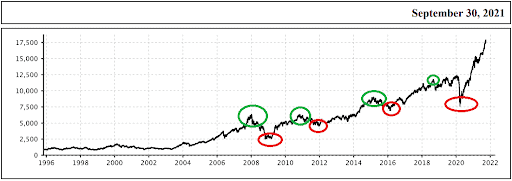
For reference, the peaks and troughs are marked in the Nifty 50 chart below in green and red respectively, to give an overall picture of the stock market rally.
Going by the EPS estimates (average of top 4 domestic brokerages) for FY22, the consensus estimate for FY22 is around Rs.710 and it is around Rs. 820 for FY23. Based on this, Nifty at ~18,000 is trading at nearly 26 times FY22 earnings and nearly 22 times FY23 earnings. As per NSE data, the trailing 12-month PE of Nifty is presently (October 25, 2021) at 27 times. A low interest scenario typically accommodates a higher PE (your willingness to pay more to get higher returns goes up in a low interest scenario).
Therefore, an estimated PE of 26 times, albeit higher than historic averages, may be the leeway that is taken for the prolonged low rate scenario. But we need to note that the FY22 and FY23 EPS estimates capture the earnings upside from cyclical sectors as well going by the rally seen in the stocks from this segment.
These sectors, such as metals, capital goods, oil & gas, real estate, PSU banks did not contribute much to India Inc.’s earnings growth (and your wealth) for half a decade. In other words, the estimates have accounted for the best case even in sectors that showed no prospects for long. That leaves very little upside to account for in terms of earnings growth, unless there is a significant rally in banks.
So, it is quite possible that even a 10% rally (say 28 times FY-22) in the short-term can push markets into the ‘overvalued’ zone leaving little margin for error on the valuations. This is likely what the market is beginning to perceive, going by the pockets of correction that has started.
Check for 20-year data on Nifty PE ratio from primeinvestor.in.

MCap to GDP ratio: Another ratio that offers clues to market valuation is the market capitalization to GDP ratio.
De-Jargonizer
Market capitalisation to GDP Ratio: This ratio looks at the value of all stocks traded in the market to the value of output in an economy (GDP). Since the assumption is that these two have to be in sync, when market cap is far undervalued then the GDP, the markets are said to be trading cheap while if they traded way above the GDP, then they are said to be expensive. The comparison, like many other ratios, is done with historical averages. This ratio is also known as the ‘Buffett Indicator’ — after investor Warren Buffett, who popularized its use.
If the ratio falls between 50% and 75%, the market can be said to be undervalued, while the market may be considered fairly valued if the ratio is between 75% and 90%. If it falls within 90% and 115%, the market may be considered overvalued.
India’s market cap to GDP ratio recently crossed the 115% mark after hovering below the 90% mark for the last several years. The ratio hit a low of 55% in March 2020 due to the out-break of COVID-19. It had hit the same level during the global financial crisis in 2009. Just before the global financial crisis, our market cap to GDP ratio touched 150%, the highest level recorded in the last two decades. In the current scenario this traditional valuation metric provides a reasonable assessment of the valuation and a 110% level indicates that the market may be getting into the ‘overvalued’ zone.
This valuation metric may lose its relevance if the nature of companies listing in the market come with a different kind of business model – like the emerging tech plays in the US. For example - e.g., if RIL demerger Jio Platforms, it may command higher PE multiple than RIL itself. Likewise, Bajaj Finance is valued much higher than ICICI Bank as a fin-tech company. High value unicorns such as PayTM, Flipkart, Byjus, Nykaa, etc. may also be making their market debuts in the future. At present, India has 66 unicorns. If such companies make market debuts at high valuations, this ratio may stay elevated in the near future and lose its significance as a reliable indicator.
#2 Stock market sentiments
Same stroke for different folks: When the market is overtly positive, it paints a pretty with no discrimination across sectors and sector fortunes quickly hopping from one to the other. From pharma and commodities six months ago, it is realty, telecom and IT now. It also heavily bets on a favorable outcome for sectors that are not yet out of the woods or those with inferior business fundamentals.
Companies in the hotel & tourism sector like Indian Hotels and quick service restaurant (QSR) chain - Westlife (Mc Donald’s), have gone past their pre-COVID market capitalisation even while the opening up of the economy is yet to happen fully. The stock of another QSR, Barbeque Nation, has doubled post its IPO while that of Burger King and Devyani (KFC, Pizza hut) have reported smart gains.
Even the stocks of multiplex chain, PVR, and fashion retailers, Aditya Birla Fashion and Trent, are near or past their pre-COVID market capitalisation, despite the fact that PVR and ABFRL had to raise more equity to survive the pandemic. Luggage maker and retailer, VIP Industries, which was a proxy to a travel boom pre-pandemic, has almost fully gained back its pre-pandemic market capitalisation. All this with very weak fundamentals for these companies.
So, is the impact of pandemic over or are these stocks running ahead of time? With significant inflow of money, a high level of optimism and narratives having takers, the buying and selling in stocks seems to be price-action driven rather than value-driven at this point. This characteristic is not uncommon in a prolonged bull market. The exuberance is not restricted to the secondary market as IPO listings will testify.
It’s raining IPOs: If we take a close look at the IPO market, it usually takes off in a big way during bull markets. As the first few IPOs debut with stellar gains, the sentiment turns up-beat and almost anything sells afterwards. Till now, 2021 has seen 43 IPOs, while more are lined up in the coming months. While the number of issues is still far from what we saw in 2007 and 2010 the money raised in those years has already been surpassed.
Over the past decade, the nature of IPOs has also changed as many companies took to IPOs to provide an exit route for private equity and venture capital money as against the traditional capital raising issues. Private equity investors provide capital to companies at early stages and then use a buoyant capital market to exit at rich valuations. Such exits are typically done when the funders feel the buoyant market offers the right opportunity to command high valuations (and on the other hand also means that they fear staying longer means losing such opportunity, if a correction follows). Consequently, it opens up a tough question for debate – Do IPOs leave enough on the table for investors? The following table will give you an idea of returns delivered by IPOs that came in bull markets.
The table above tells you that only 23% of stocks listed during 2007 gave positive returns since then (to date) while it was 22% for those listed in 2010. The percentage has significantly improved for stocks listed in the 2017-18 period to 56%. This period saw many high quality companies with strong earnings growth debut. It needs to be seen how the listings during the current IPO boom will end up in the years to come.
NFOs too are not far behind: Not just stocks, mutual fund new fund offers (NFO) are also seeing a big thumbs up. SBI MF collected a whopping Rs. 14,500 crores from over four lakh investors through its Balanced Advantage Fund NFO in August 2021, the highest ever for an open-ended equity fund during its NFO period. In July 2021, ICICI Prudential Flexicap Fund collected Rs. 9,500 crore, the highest ever NFO collection up until then, a record that was broken in a month. 2007-08 also saw record collection in mutual fund NFOs. Themes based on infrastructure that were market favourites then were lapped up by retail investors.
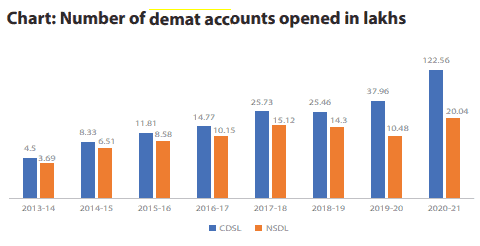
New demat accounts: A buoyant capital market also leads to a large number of demat account openings. If we look at the chart below, you can see the sharp increase in the number of new demat accounts in 2017-18 following which it stagnated as markets corrected. But what we will see in 2020-21 is manifold times that. The 3X rise in new demat accounts in a pandemic-ridden year as against the average for the past three years is nothing but a reflection of a buoyant stock market sentiment. This may also have to do with low interest rates as well as the ease of opening accounts. However, stock market returns and a buoyant IPO market are key drivers of the number of new demat accounts.
Stock market turnover: The stock market average daily turnover (value of trades in cash market segment of NSE) has also seen a significant jump from Rs. 11,200 crore in FY 2013-14 to Rs. 61,800 crore in FY 2020-21. It was just Rs. 36,400 crore in FY2020. Data released by the exchange early this year points to 45% share of retail investors in overall trading turnover.
While these data points on a standalone basis are not any sign of market excesses considering the size of the population and low levels of participation in equity markets, overall, the sudden spike in new demat accounts, fresh issues and market volumes during a bullish market phase, can all be alerts about the high market sentiment.
All of these indicate just one thing: that the system is flush with money. Whether it is IPOs or new demat accounts, there is money that is waiting to be deployed. When liquidity is at play, fundamentals can take a backseat. That means the market can get overheated without your realizing it since the bellwether indices scaling new heights can only trigger positive sentiments.

Do all good things come to an end?
Well, they do in life. But for markets, it is more of a cycle and history offers some cues here. History tells us that a richly valued stock market alone need not suggest that a market crash is imminent. Major corrections have happened due to outlier events that have had a ripple effect across economies be it the Asian Financial Crisis in 1997 or the US financial crisis in 2008. If we look at the last two decades, two major crashes (>50% fall in indices) have happened only due to such extraordinary (called black swan) events.
Outside of such extraordinary events, the stock markets move in cycles with several tops and bottoms. The returns are never linear as it is an active system where every news can create an impact, be it a pandemic, climate change, demand-supply for goods and services, interest rates, fund flows or a shift in the balance of power in the global economy.
Below is a chart of the Nifty 50 Index over the last two decades.

Source: NSE India, Nifty50 fact sheet
Excluding the corrections due to black-swan events, other major corrections have been to the extent of 15% to 30%. There have been only two major timewise corrections (that lasted for a year or more). The one between Nov 2010 and Dec 2011, and the other between March 2015 and Feb 2016 to the extent of 28.5% and 25% respectively.
Interestingly, recent corrections have happened due to interest rate actions. In Nov 2010, the stimulus measures post the global financial crisis, resulted in over-heating of the domestic economy and the RBI had to go in for a series of rate hikes. In 2015, the RBI decided to keep rates high despite an ailing economy which did not go well with the market. But post 2015, interest rates dropped by almost 50%, from the peak of 8% to 4% now, giving a significant leg-up to market returns despite an anemic economic growth.
The correction of 16% in mid-2013 and 15% in the beginning of 2018 due to US FED stimulus wind-up/rate tightening lasted only a few months as concerns abated. The period between mid-2013 and early 2014 also saw emerging economies facing a currency crisis (when the rupee hit Rs. 70 to the US dollar in August 2013) as the US FED prepared for stimulus winding-up.
What are the macro concerns now that can trigger a correction? Aplenty. Let’s list a few:
- While there is news on the possibility of the US FED stimulus wind-up starting later this calendar year, crude oil is on the boil joining other industrial commodities.
- Central banks, both domestic and globally, have down-played inflation concerns so far while supply disruptions are getting more severe.
- Right from container shortages to rising commodity prices, manufacturing disruptions in China to a global energy crisis, the supply concerns don’t seem to be abating soon.
- A fresh round of thought is that there is significant under-investment in capacity creation in the last decade due to environmental concerns.
So we spoke about less comforting valuations, high liquidity and macro concerns. And yet, the market chugs on. But when the markets remain elevated for a long time, one negative trigger can set the ball rolling for a series of negative events. What can you do as an investor to avert any pain or reduce it, when a correction does happen?
- Long term investors have less to worry as they have to go through up and down cycles to reap the benefits of equity returns eventually. Timing the market is impossible. But, for those investors who follow asset allocation, this may be a time to check and re-balance the portfolio accordingly. Take a look at our re-balancing calculator to make sure you are on the right track.
- For those with high equity allocation, this may be the right time to check the quality of companies in your portfolio and also look out for any profit booking opportunities where valuations have gone up substantially. If the recent correction in small cap stocks is any indication, this could be the segment to book out first.
- Short term investors need to be wary of going too optimistic and pumping more money into the markets especially in smaller companies with poor fundamentals or low liquidity. Check our Stock Ranking Tool to check how the various companies in your portfolio fare in terms of growth, quality and valuation (for the top 500 stocks).
- New investors would do well to take a conservative approach, having an asset allocation and using the mutual fund route through index funds and taking slow exposure to equity once they get familiar with the idea of investing in equity through funds. If you are a new entrant looking to begin your investing journey through mutual funds, check our index funds. For stocks, our equity screener will come in handy to sift through a large universe and narrow your choices.

Conclusion
High market valuation alone need not have to be a trigger for correction. A correction need not always be a massive one like in 2008. It can be short ones that remove froth. Those are healthy and necessary. Those are also more common as illustrated earlier in this article. The correction can also be disproportionate and in some pockets like IT in 2001 and infrastructure and real estate in 2008. Hence, frothy sectors in bull markets need to be treated with caution. Asset allocation and systematic investing can help reduce the pain of such corrections.


2 thoughts on “Are equity markets overheated?”
Can you share the sector wise valuation hype, esp IT, Banks, FMCG etc – vs two there comparable crash periods thx
Welcome your query sir
We have a tool called “Stock Screener” where you can choose a “sector” from left menu and look at it on various valuation parameters.
Below is our recent article on Investing Approaches where IT sector is covered along with valuation. Given also a video link on how to use the “Stock screener” also. You can EXPORT the data to Excel also.
https://primeinvestor.in/top-down-and-bottom-up-approaches-to-pick-stocks/
IT had its peak on valuation in 2001 (during Nasdaq bubble) while banks haven’t gone over-board.
For FMCG, they are at highest in a decade as the PE expansion for the sector started somewhere in 2011 from 25-30 times to 75-80 times recently.
Generally, valuation bubbles happen in sectors where high growth is there/expected while there is lot of investor interest based on story/narratives rather than visible earnings
Hope this provides with some insights. Kindly go through our stock screener for data/numbers for each sector.
Thank you
Comments are closed.