The author is an external contributor. Views are personal and do not reflect the opinion and views of PrimeInvestor.
We have been voicing concerns in the past few updates about the rising volatility and lack of participation from the broader market. We also suggested in the last update on the Nifty 50 that the markets are getting very stock and sector specific and this is probably not the time to make lumpsum investments. While there is broadly no change to this thought, let us look at the short-term Nifty outlook and some historical context about market behaviour.

Nifty short-term outlook
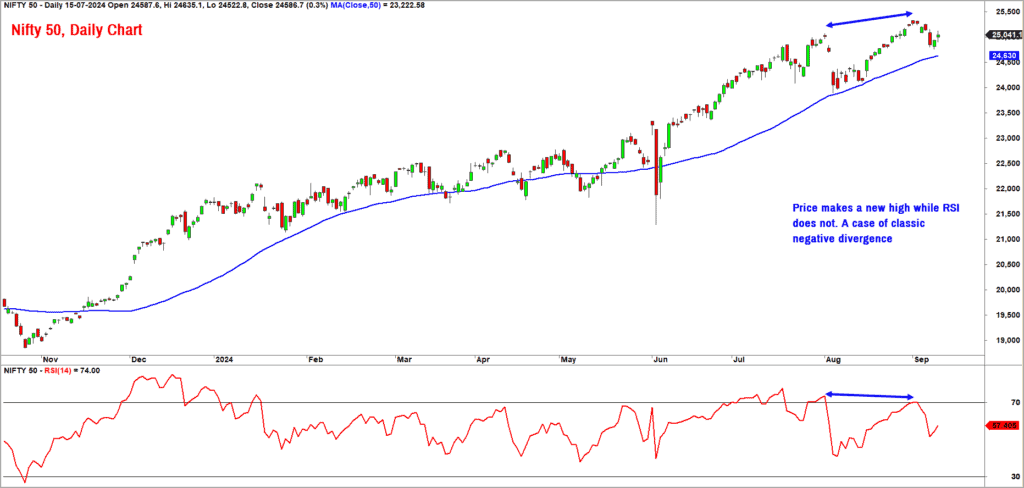
Here is the daily chart of the Nifty 50 index. As highlighted in the chart, there is glaring negative divergence between the price action and the 14-day Relative Strength Index (RSI) indicator. While the price has recorded a fresh all-time high, the 14-day RSI has failed to do so. The indicator has recorded a relatively lower high, suggesting lack of momentum.

A similar negative divergence is visible in the weekly charts too, suggesting slowing momentum in the recent up move. Though the Nifty 50 index just edged past the bullish trigger level of 25,200 that was mentioned in the previous update, there was a quick and sharp reversal thereafter. This indicates lack of follow-through and waning momentum.
A look at the breadth indicator suggests that there is a possibility of either a time- or price-wise correction in the Nifty 50 index. The Nifty Bullish Percent Index breadth indicator has turned lower from the overbought zone and is trading below its 10-day moving average. The Bullish Percent index is a study that captures the percentage of stocks that are in a buy signal in the Point & Figure chart. We have used the 0.25% box size in the Point & Figure chart to assess the short-term breadth of the Nifty 50 universe.
From a short-term perspective, Nifty 50 is likely to remain broadly in a range but the volatility is likely to spike up. There is nothing outrightly bearish or negative in the charts yet. But the breadth, especially in the bigger time frames need to cool off. Hence, expect some volatile price action within a broad range of 24,000-25,500.
Do not expect any significant trending move until the price breaks out of this range. As always, we will keep you updated with fresh targets once there is a significant breakout or a significant change in price behaviour.
Let us take a quick look at the historical price behaviour to place the action in 2024 in some context. We shall look at how volatility behaves in the bull market and bear market.
Historical Perspective
Let us begin with the daily behaviour of the Nifty 50 index. Here is a chart capturing the number of days in a calendar year where the index has either gained by 1% or more or dropped by 1% or more.
The data from 1995 till 2023 indicates that on an average, the Nifty 50 index falls by 1% or more on 42 days in a calendar year. Obviously, there are years where the number is much lower like in 2023 which was a strong bullish year.
In bull markets, the price action tends to be more sober and steady, with minimal spike in volatility. In contrast, during bear market or volatile corrective phase, it would not be unusual to witness a spike in number days where there has been 1%+ gain or 1%+ fall. This behaviour of a low volatility regime in a strong bull market has played out in the US markets too where there is more historical data to study.
Let us look at a couple of recent examples in the Indian context.
In 2017, the Nifty 50 index was in a steady uptrend and there were 13 days of more than 1% gains and just 8 days where the fall was 1% or more. The biggest one-day fall in 2017 was 1.6% while the biggest single day gain was 1.8%.
The data of the more recent bull market of 2023 indicates a similar behaviour. The worst one day fall during this bull run was 1.41% and the top daily gain was 2.07%. The price action basically was devoid of any big spikes in either direction.
In contrast, in 2022, there were 37 days of a more than 1% fall and 42 days of more than 1% gain. You may recall that 2022 was a year of broad range-bound price action with Nifty gyrating wildly during the year. In the volatile phase of 2022, the best daily gain was 3.03% and the worst single day fall was -4.78%.
In the current year 2024, the count of days with gains/falls of 1% or more has almost matched what happened in 2023. We have had 12 days of 1% or more fall this year compared to 14-days for the entire duration of 2023.
What does this indicate? It means that 2024 is a year where volatility has spiked, and it may be the case for the remainder of the year as well. The other interesting aspect in 2024 is that worst daily fall has been -5.93% and best daily gain is 3.36%. This again is not a typical bull market behaviour. It is more reminiscent of a volatile phase that prevailed in 2022. Given this context, it would be reasonable to expect more such volatile price action rather than a smooth uptrend in the last quarter of this year.
Nifty SmallCap 250
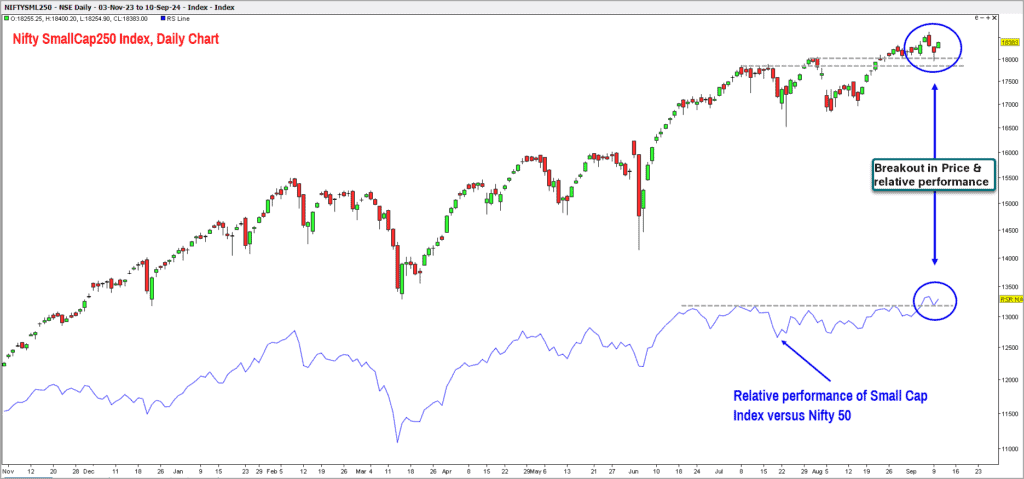
As highlighted in prior updates, the Nifty Smallcap 250 index has been an underperformer versus the Nifty 50 over the last several months. More recently, there are signs of some improvement in the relative performance of this segment. This index clocked a fresh all time high recently and interestingly, the relative performance too made a fresh high, suggesting that this index is probably regaining its mojo.

The recent swing low of 16,700 is the trigger level below which the trend is likely to turn bearish. A close below 16,700 would be a major sign of weakness and could open up further downside targets extending up to 14,800-15,000. The trend for the small cap index would be bullish as long as this level is not breached. Also keep an eye on the relative performance of this index versus the Nifty to ensure that this index that this index is outperforming.
Be selective and stock specific and look for short-term swing trading opportunities within the small cap space. Do not look to ride the investments for long-term as we expect volatility to remain elevated for the overall market. In this context, this index too might bear the brunt of the expected wild gyrations in the Nifty.
Sector indices
Now let’s take a look at some sector indices that present interesting trends and opportunities.
- Nifty Pharma: We have been bullish on this index for a while now and this index remains a star performer. It continues to be a strong outperformer in relation to the Nifty 50 index. The short-term outlook for the Nifty Pharma index remains bullish and the price has also crossed the upside target of 22,800-23,000 mentioned in the previous update. The next target for the index is 23,800-24,000. Only a fall below 20,400 would invalidate this positive outlook for the Pharma index.
- Nifty IT Index: We have been voicing a bullish outlook for this index, too, in recent updates. Along with pharma, the IT Index has been a star performer and has also displayed outperformance in relation to the Nifty 50 index. Similarly, this index too is trading near all-time highs which is a sign of bullishness. The IT index can head to the immediate target of 44,500-45,500. This view would be under threat if the index falls below 38,400.
- Nifty FMCG index: Along with Nifty Pharma and Nifty IT, this is the third index that is bullish and is a strong outperformer versus Nifty 50. The immediate target for this index is 66,100-68,600. A fall below 59,300 would be a cause of concern. Until then expect the index to reach 68,600 sooner than later.
- Nifty Bank Index: We continue to maintain a cautious stance in this index as it remains a terrible underperformer versus the Nifty 50. A fall below 49,500 would be an early sign of weakness while a breach of 46,800 would open up major downside targets for this index.
To sum up, the Nifty 50 index is likely to witness a spike in volatility while there is nothing alarmingly bearish yet in the price chart. As emphasised in the previous update, be cautious and extremely selective in picking stocks. Look for stock / sector specific opportunities and take strategic short to medium term bets. This is probably not the time to make big lump sum allocation in the market.


3 thoughts on “Technical outlook: Is momentum waning for the Nifty 50?”
Thank you sir for your inputs. It would be great if you could shed light on PSU Bank index also from technical perspective. This has been a star perform up until elections but since then has massively underperformed. Is there steam left or should one exit?
Hello:
As you rightly observed, the PSU Bank Index has been an under-performer versus Nifty 50 index. Hence, there is no reason to consider fresh exposures in this sector for now. If you are already invested in this sector, then my suggestion would to be stick to your exit plan. We have talked a whole lot about the need to have an exit plan for your investments. If you do not have one, then it is never late to get started on the plan. The exit plan should be logical and in sync with your investment time horizon and risk profile.
A simple suggestion would be to use the 200-day moving average for long term holdings (holding period of more than 2-year). For tactical and for shorter term trading, the 50-day moving average could be an effective exit option. A close below the chosen moving average can be a red flag that could prompt you to reduce and or exit your holdings. Remember there is no holy grail and this exit is effectively an insurance to protect you from covid-led 2020 kind of disaster.
Aside from the exit plan, it is also equally important to have a logically sorted out stock selection and entry criteria.
As far as the PSU Bank index is concerned, the price action has deteriorated considerably for short-term traders. The price is below the 50-day moving average. There is a ray of hope as we are currently trading near support levels. The trend could turn bullish if the price turns around swiftly and crosses above 7,300. If not, expect a range bound or downward drift to persist.
Hope this helps.
B.Krishnakumar
Thank you sir. Will monitor the support levels. And yes, 200 DMA is a good guardrail and glad that you also have the same view of using 200 DMA as an indicator.
Comments are closed.