Manufacturing is the new favourite keyword in the market. If you have noticed the narratives of many money managers as well as the portfolios of funds, you will find that the manufacturing space is gaining favour.
With the government’s thrust on defence indigenisation, PLI schemes for electronics, auto and textiles and changing order of global supply chains, the broader manufacturing theme appears set to carry higher weights in investors’ portfolios in the near future.
According to a recent report by Bain & Co titled ‘The Trillion-Dollar Manufacturing Exports Opportunity for India’, India’s manufacturing exports are expected set to touch the $1 trillion mark by 2028 led by automobiles and machinery, chemicals and pharmaceuticals, electronics and textiles
If we look at the listed manufacturing sector in India, automobiles along with auto components and capital goods are the two largest sectors followed by pharmaceuticals, metals and chemicals.
So, the investment opportunity in the manufacturing sector appears to largely revolve around automobiles and auto components, engineering and capital goods, pharmaceuticals and chemicals, textiles and emerging sectors like electronics.
When it comes to analysing manufacturing companies, there are three important balance sheet ratios to look at:
- Fixed Assets Turnover ratio (FAT)
- Return on Capital Employed (RoCE)
- Debt to equity ratio (D/E)
Now let us get into in detail about the significance of these ratios for manufacturing companies.
#1 Fixed Assets Turnover Ratio (FAT)
Most manufacturing companies are capital intensive. That means companies will have to invest in fixed assets to sustain growth. So, FAT (Sales/ Average fixed assets) is a key ratio to assess two things:
- how much sales a company is generating from its fixed assets
- how much money a company will have to invest in future to grow
This ratio will be different for different types of manufacturing companies. Few examples are given in the below table. Just to explain it, a fixed asset turnover of 5 means that the company is generating Rs 5 worth of sales for every Re1 invested in fixed assets. So, a higher ratio denotes better efficiency of assets to generate sales. But then, there can be outlier occurrences as well and we need to carefully interpret the ratio at such times.
For example, in the case of a sector recovering from cyclical downturns, FAT ratio may appear depressed due to lower capacity utilisation. So, the ratio has to be looked into by taking into account the capacity utilisation as well.
A lower capacity utilisation can also suggest that the company has enough room to generate additional sales without investing in fixed assets in the near future. Below are the key financial parameters of one such company from our AUTO++ Smallcase.
The company’s FAT ratio has fallen from 5 in the last 3 years due to the downturn in industry, while it is operating at <60% of its capacity.
Please note that a high FAT turnover ratio does not tell anything about a company's profits or cash flows. It gives an indication of whether a business is asset heavy or asset light. Its impact on the RoCE is explained in the following part.

#2 Return on Capital Employed (RoCE)
This ratio is used to assess the capital efficiency with which a business is run. It is calculated as:
RoCE = Earnings before interest and taxes/ Average capital employed
RoCE will give a clear indication on whether the business is making enough return on its investments to be eventually able to generate enough returns to shareholders, measured in terms of Return on Equity (RoE). Unless RoCE is comfortably above the cost of capital, the company is unlikely to generate returns for shareholders.
Let us break the RoCE down to understand the key drivers of it
Drivers of RoCE
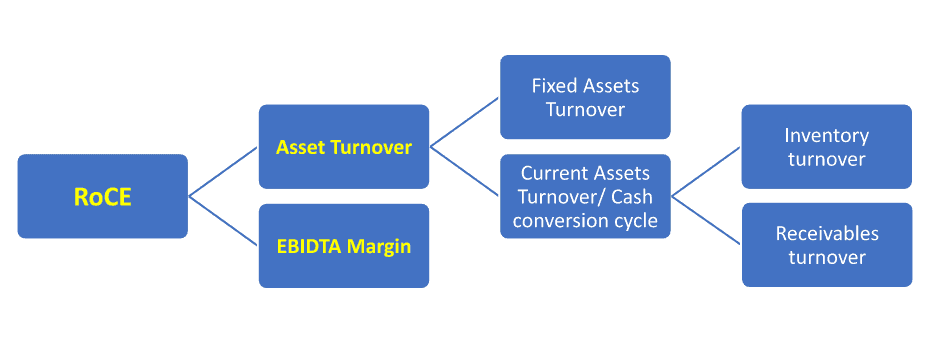
Asset turnover and EBIDTA margin are the key metrics to look at to understand what is the key driver of RoCE for any company. The asset turnover in turn breaks into fixed asset turnover and current assets turnover or cash conversion cycle
(While we use EBIT for RoCE calculation, let us use EBIDTA margin for illustration here since it is commonly used. We are just using it to separate between high and low margin businesses)
Below are some of the top manufacturing companies from different sectors. Prime facie it may seem that the companies leading in RoCE are not necessarily the ones with high FAT and EBITDA margin and good cash conversion cycle.
But If we examine the key drivers of RoCE, for some, it is high margins that is leading to high RoCE (Balkrishna) while for some others it is high asset turnover (Dixon, APL). For the remaining it is a combination of both (Bajaj, SKF, Supreme). For Bajaj Auto, RoCE would be near 3 digits if we exclude its mammoth cash balance of over Rs.20,000 crore.
But a high RoCE alone will not guarantee high stock price returns. Growth is a necessary ingredient for stock returns. While Bajaj Auto is a manufacturing company with best-in-class financial metrics, it did not top the stock return charts in the last 3 to 5 years due to poor earnings growth.
Below are the growth metrics of the above-mentioned companies in the last 3 years:
In the above stocks, the highest returns in the last 3 to 5 years have come from stocks with high double digit profit growth such as Balakrishna Industries, APL Apollo and Dixon Technologies.
So, superior RoCE along with earnings growth is key to returns. We have earlier written about the ingredients for high returns in our article – magic formula to identify multibaggers. Do read it.
Is the RoCE driver sustainable?
Though past RoCE track-record may provide some assurance about its trajectory, if you are buying stocks at rich valuations, you will do well to dig deeper to understand what is driving the high RoCE.
Below is a comparison of two manufacturing companies from different sectors with superior RoCE
What is driving RoCE for Dixon is its frugal working capital management and high FAT, as you can see from its FAT ratio and cash conversion cycle. Electronics manufacturing business globally is a low margin business and Dixon has been building significant scale in manufacturing to churn out high RoCE. To put this in perspective, in LED lights and LED TV, the company has > 50% and > 25% of all India manufacturing capacity respectively, pointing to its scale.
On the other hand, Balkrishna Industries is a high capex business with a low FAT ratio. But, by building a niche for itself in the export market, the company has been able to generate superior EBIDTA margins and in turn superior RoCE in the entire tire sector. So, there are different factors driving high RoCE for these two different manufacturing companies.
These companies will have to sustain these factors in the long run to maintain their high RoCE.

Even changes in demand and pricing environment, leading to better margins can drive RoCE higher. This happened with the chemical sector and recently with the steel sector and glass sector due to lower supplies from China.
Even a brand-supported pricing power can help a company sustain high RoCE. In such cases, competitive forces may try to enter such a sector and disturb that equation. Below are few such companies with brand led pricing power.
While these companies are known for their margins and superior RoCE, these sectors are attracting new players. For Asian paints and Berger - Grasim, JSW and JK Cements have made entry into the paint sector whereas as for Page Industries - NYKAA has recently announced foray into men’s inner wear and athleisure segment, apart from Aditya Birla Fashion making inroads with its Van Heusen brand.
This makes it important to dig deeper and see if a company can sustain the key driver of RoCE for a longer period of time, especially if you are buying a stock at expensive valuations for its superior RoCE. If it is not sustainable then it can be a warning signal for that company’s stock. This is the qualitative side of research you will need to do. Below are some insights on what to look at.
Economic Moat: This term stands for the competitive advantage that a company possesses over the competition. So, long term investors generally look for companies with high economic moat. The term itself is coined by Warren Buffett.
For more insights, you can read Motilal Oswal’s 17th wealth creation study on economic moat and 18th wealth creation study on Uncommon Profits
Darwinian Advantage: Beyond the Competitive Advantage is the Darwinian Advantage. Competitive advantage focuses mostly on barriers to entry, which may prove short lived. Darwinian advantage is about continuously raising the bar not just on barriers to entry, but also on barriers to success.
In fact, this is what separates a highly profitable company in the same sector from others. Porter’s five forces model: This is another method to assess the competitive advantage of a business in the present time of supply chain disruptions and changing order in world trade. For insights, The Competitive Strategy: Techniques for Analyzing Industries and Competitors : E. Michael Porter: Amazon.in: Books
#3 Debt to Equity Ratio (D/E)
This is another important ratio for any manufacturing company with significant implication for valuation. Debt is not a sin, but excessive debt can kill companies.
In the past, companies in textiles, cement, irrigation, metals, auto ancillaries, capital goods, retail etc have landed in deep trouble due to piling up of debt. Popular names include JP Associates, Alok Industries, Sintex Industries, Jain irrigation, Binani cement, Bhushan steel, Amtek auto, Crompton greaves, Subiksha retail and Future retail, name a few
While markets ignore piling up of debt during good times, things will change when industry cycles turn downwards and cash flow starts to take a hit. So, apply the following checks during your initial research process itself when you are looking at the debt equity ratio.
- Apart from looking at growth and RoCE, check the operating cash flows and look a bit ahead to see how much % of EBIDTA is being converted into operating cash flows. You can use the “Operating cash flow/EBIDTA %” filter in Prime Stock Screener
- In case of companies with D/E ratio above 1, be extra cautious about the business and its ability to generate cash flows in a downturn, especially when it is a cyclical/semi-cyclical industry.
- If the company has huge capex ahead or any planned acquisitions, check the impact on D/E ratio. Acquisitions generally happen during good times using debt.
When markets take note of any trouble in debt servicing, it will lead to a sudden collapse in stock price and investors may not get any time for evaluation or exit.
To sum it up, the three ratios discussed above will throw light on the growth prospects, capital investment, capital efficiency and also the balance sheet health. While all these are important, they need to be combined with qualitative research to judge the sustainability of RoCE.
Use all these ratios at one go - DuPont Analysis
This is a powerful tool that will help to understand what is the driver of shareholder returns or RoE (instead of RoCE). While this is a different exercise, it also narrows down to similar parameters - margins, asset turnover and debt to equity which we have discussed earlier.
DuPont Analysis breaks down RoE into three components – net profit margin, asset turnover and equity multiplier (leverage)
DuPont Analysis:
RoE = PAT/Sales * Sales/total assets * Assets/Equity
PAT/sales: This is nothing but PAT Margin. Higher the margin, higher the contribution to RoE
Sales/ total assets: Also known as Total assets turnover ratio, this is an efficiency ratio used to determine how well a company is utilising its assets to generate sales. Higher the ratio, higher the contribution to RoE.Assets/Equity: This ratio measures financial leverage and is calculated as total assets/total equity. It indicates whether a company finances the assets through debt or equity. Higher the ratio, the more debt the company has in relation to its total assets.

DuPont Analysis will clearly throw light on what is driving RoE – whether it is margin or asset turnover or leverage or a right combination of all.
This analysis can be done for a longer period of time to understand whether any material change is happening to a company in terms of its margin or asset turnover or leverage.
Below is 10-year DuPont analysis of Asahi India glass where the company has moved from losses to healthy profits while its leverage (as can be seen from assets to equity) has continuously come down leading to valuation re-rating.
DuPont analysis can also be used to compare two companies within the same industry to understand why one is better over another, be it in performance or market valuation.
Here are some of the examples from various manufacturing industries we have discussed above.
You will see from the above that while both Dixon and Amber are low margin businesses, the driver of high RoE for Dixon is asset turnover while the same is not up to mark for Amber, leading to poor RoE.
In the example of KPR Mills versus Arvind, KPR has been able to deliver on every parameter to deliver industry leading RoE while one of the oldest players, Arvind Mill has always struggled.
Here, Sundram Fasteners has been able to deliver on every parameter while it is higher leverage that is driving RoE for M M Forgings.
V Guard has been able to deliver on every parameter while it has higher leverage that is leading to even mediocre RoE for Bajaj Electricals.
How does the market value these companies?
The ratios mentioned above can tell many stories alright. But let us see how the market is valuing the companies we discussed. Below is a table of valuation of the above discussed companies on three key parameters – PE, Price to book value and market cap to sales.
We can see from the table below that the market has been awarding superior valuations to the ones generating superior RoE with the right combination of margins, asset turnover and leverage while pricing the ones with inferior fundamentals lower.
Do note that V Guard Vs Bajaj electricals is an exception where both are getting similar valuation (Bajaj higher in P/E) despite V Guard enjoying a superior RoE profile as per DuPont analysis. This is because Bajaj Electricals recently announced the demerger of its less profitable EPC business, leading to valuation re-rating.
To sum up:
- The ratios discussed above act as important screeners to ensure you pick stocks with superior efficiency in the manufacturing space.
- The ratios alone won’t guarantee stock returns if growth is absent. But what you can expect such companies to do is contain downside well in periods of down cycles.
- Markets afford premium valuations to companies with superior efficiency and low debt.
- But sustainability of such efficiency is important. In ratios such as RoCE, what is driving the returns and sustainability of such returns is very important to know before you pay premium valuation to buy the stock of a company.
- DuPont analysis is a very useful tool to combine the ratios we discussed and make comparisons between peers.
The securities quoted are for illustration purposes only and are not recommendatory.


4 thoughts on “3 ratios to pick winning stocks in the manufacturing space”
Brilliant article. Examples really help with easy understanding. Thanks for putting in the effort of so many comparisions. For beginners like me, very useful to understand. Good articles like this take us a step closer to subscribing for your other services. Thanks for the good work.
Sir
Very good article.
How do we get the data for doing these types if analyses.
Thanks
Thanks for writing
Most of the data like PE, P/BV, Sales growth, PAT growth, RoE, RoCE, debt to equity and cash conversion cycle are available in our stock screener itself. You can create watchlist with required parameters, save and download in excel using our stock screener
Pl refer to our previous 2 articles on how to use our stock screener. There is also a video attached with the articles on how to use our stock screener.
DuPont analysis may not be available readily. But, for that a template can be easily created in excel with the formulas mentioned. All the data for it are readily available in the annual balance sheet & Profit and loss account of companies
Thank you
Great article!
Comments are closed.