If you have been a seasoned investor, then you will not fail to correlate market returns to the GDP growth of a nation using the market cap to GDP ratio. GDP growth gives a quick sense of the size of the growth opportunity and in turn that of the stock market valuation. We call it the Big Picture.
Textbook wisdom says that market valuation follows GDP and that a market cap to GDP ratio of over 1 suggests over valuation and vice versa (This market cap to GDP ratio is also popularly referred to as Buffett indicator).
If the Buffet indicator works perfectly in the way it is defined, then investors can easily play around markets by buying and selling stocks or ETFs based on this ratio and pocket smart gains. But unfortunately, it hasn’t worked that way if we look at the facts that back these data points.
In this article, let us try and understand what the Buffet indicator really points at, the disconnect between the GDP and market cap and how to interpret this for stock market decisions.
Buffet Indicator for countries
Here’s a quick look at the Buffet indicator (Market Cap to GDP ratio) of top 10 economies in terms of nominal GDP (image below). You will find that while US enjoys a high premium over GDP, countries such as China and Germany have a ratio of less than 1, even as Russia’s market cap is significantly depressed than its GDP!
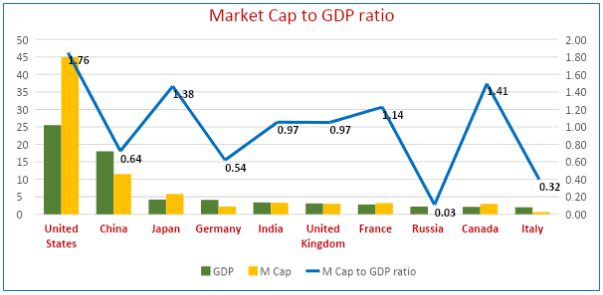
Note: (1) These are approximate values for GDP and stock market capitalisation. GDP data is for CY22 for most of the economies and FY22 for India. Market capitalisation is the approximate values as on current date. Both the data are taken from sources that are considered to be reliable.
(2) This data may sometimes be misleading if there are very large unlisted corporations in a country. But majority of large companies contributing meaningfully to economy seems to have listed in top countries mentioned in the graph. (Just for sample: Saudi Arabia’s market cap averaged $60bn up to 2018 while it spiked past $3 trillion post Aramco’s listing).
This data can be easily deceptive, unless you find answers to some of the questions that this data poses. For example:
- Why is US’ market cap far higher than its GDP and China’s is far lower?
- Why does Germany (let’s include UK for this purpose) as a large economy not have large stock market valuation?
- Is Japan’s Market Cap at 1.4X GDP fair considering its low economic growth rate? Why has been it been afforded a higher ratio?
Let us try understand each of these cases.
# 1 Market cap to GDP ratio – US vs. China
Presently, US is about a $25 trillion dollar economy while China is $18 trillion. For US, the market cap to GDP ratio is close to 2X while at the other extreme it is close to 0.7X for China. Historically for US, it has hovered far below 100%, barring the spike in 2001 during dot com. But then, it has consistently moved up in the last decade. This also coincided with the rise of companies from the technology sector that are global in nature.
If we rewind it to the previous decade or before the 2009 financial crisis, the U S stock market index was dominated by oil and financial majors that derived their value largely from home economy. But the technology revolution created dominant companies that started ruling the world. If 2000s was about $100 billion valuation companies, the next decade was about $300- $400 billion valuation companies and this decade led to the birth of multiple trillion-dollar companies in US.
Take a look at this link for top companies by market value in the US. You can see that US has over 10 companies with over $500 billion in market value and more than 75 companies with market value above $100 billion.
Now if we look at China, the economy is the second largest but is dwarfed by the US. But if we look at top companies, there are just 14 companies with market value of over $100 billion, but none above $500 billion (there could have been Tencent and Alibaba if a government crackdown did not happen).
Here’s a link to take a quick look into top companies by market value in China. The largest one is still Tencent Holdings at $380 billion followed by Alibaba at 4th at $222 billion and then the new energy (Li-battery, EV) enterprises like CATL and BYD at around $100 billion. Out of 14 companies above $100 billion in market cap, half of them are public sector enterprises operating in domestic financial, energy, telecom, construction, and insurance sectors.
If you go further down the order, the next 14 are $50 billion companies, with lot of domination from public sector enterprises again. Largest online food delivery platform (Meituan) and a gaming company (NetEase) also find place among the $50 billion companies. The ones from electronics, appliances, air conditioners, sports goods, automobiles, etc go far lower down the order in market cap. The conventional auto manufacturing companies (Great Wall, SAIC) are not even bigger than India’s Tata Motors or M&M or Maruti in Market Cap.
Why not multiple $100 billion private enterprises in manufacturing despite China being known as the factory of the world? That will be something to ponder over and is a separate topic of discussion.
But to conclude based on available information, a larger proportion of public enterprises, lack of global brands and restrictive government policies in China seem to have created significant difference between the stock market capitalisation of these two countries. Even for large investors including large funds, whether their diversification to markets like China, seeing its economic growth and prosperity, have played out in terms of stock market returns has become questionable.
(Read this article that talks about how avoiding China has been a winning bet for some global funds. )
#2 Market cap to GDP ratio - Eurozone markets
Now let’s move to the major Eurozone markets (including UK for this limited purpose).
We know that Germany is the saviour of Euro Zone and the country with the largest GDP. Every time the Euro Zone lands in financial crisis, it is Germany that takes the centre stage in policy making to save the Euro. The next is France. Both are known to be industrial nations. Germany is a $4 trillion economy while France is $2.8 trillion.
But the stock market data points out to significantly higher market capitalisation for France than Germany. How? In fact, France has a Buffett indicator ( market cap to GDP ratio) of 1.1 while it is only 0.6 for Germany. Let’s dig a bit deeper to understand what creates this meaningful difference.
A quick look at top companies reveal that Germany has just 3 companies above $100 billion whereas France has over 6 companies above $100 billion. The largest German company has $150 billion in market Cap while the largest French company has $380 billion in market Cap.
SAP, Siemens, Porsche, Merc, BMW, Volkswagen, etc. make for top German companies by market cap and they truly represent what Germany is known for – an industrial nation.
But which all make Top companies in France? They are LVMH, L’Oreal, Hermes, Dior, Essilor Luxxotica, Total and Schneider. Yes, it’s a whole bunch of beauty and fashion players dominating an industrial nation’s stock market index. The old-world manufacturing names you would expect such as Safran, Dassault, Thales, Legrand, Michelin, Renault, and Alstom are far low down the order.
While the German auto giants as well as French beauty and fashion majors find significant favour globally, including China, the fashion and beauty majors have ended up creating more shareholder value. But the auto industry has been less profitable and less value creative globally, barring Japanese major Toyota.
The stock price charts of auto majors also shows that they are haven’t done anything in the last two decades (barring BMW). Disruption from EV makers like Tesla added to the woes of the sector while Chinese players are outselling Germans in the fast-growing EV segment.
Worse in the Eurozone is Italy, with a Market Cap to GDP ratio of 0.32 and has NO $100 billion companies in its index while similar sized economy Spain does significantly better with a market cap to GDP ratio of 0.90 and fashion retailer Zara as the sole $100 billion company.
You may have also observed from that data that UK beats Germany in stock market capitalisation with 7 companies in the $100 billion club Vs 3 for Germany despite being lower in GDP by a trillion dollar. UK still has its flagship oil and mining giants in top companies, carrying its stock market legacy.
To sum up, the Germany Vs France story is a lot different from the US Vs China. In the Eurozone story, it is about certain industries driving significantly higher shareholder value creation than others despite both the countries having globally recognised private sector enterprises.
#3 Market cap to GDP ratio - Japan
This is another interesting case study where the stock market of a nation with anaemic long-term growth is commanding a higher market cap to GDP ratio at 1.4 times than that of a high growth country like India at 1 time.
Japanese GDP grew rapidly between 1980 and 1995 from $1 trillion to $5.5 trillion and has stagnated for three decades since, after the asset bubble (Nikkei Bubble) in 1989. A period of high economic boom combined with huge savings and investments eventually led to an asset bubble in 1989 and the collapse of that bubble left the country in long term deflationary spiral.
To put this in perspective, Japan was almost 45% of global stock market capitalisation at that time (Same as what US market cap is today). Economic growth averaged between 0-2% for three decades past 1990 due to this. Meanwhile, the stock market bottomed out (between 2009 and 2012) after two decades of decline and is now marching towards its older 1989 highs. Warren Buffett’s investments in Japanese conglomerates recently also gave a new life to the market.
While this was happening, Japanese corporations were earning through exports, and today they export $900 billion worth of goods annually. Hi-tech manufacturing sectors like automobiles, electronics, automation, and semiconductors lead the list of top companies in its stock market with nearly 5 companies above $100 billion and 20 companies above $50 billion. Japan born PAN Asian fashion retailer Uniqlo is at 6th position with a market cap of $73 billion.
This would not have been the outcome had the companies been largely generating revenue internally (within Japan), with unfavourable demographics and anaemic growth rates. Toyota still stands tall as the most valued automobile company after Tesla, in an industry that is struggling to create shareholder value.
Just to digress a bit and give you some contrast here - India’s case is just the opposite as majority of companies that contribute to the market capitalisation generate domestic revenues (financials, consumer, and automobiles) while the enviable services export companies also contribute meaningfully with a combined market value of over $370 billion. They have added a layer of high-quality companies leading to significant market cap contribution.
At this point of time, India has 12 companies above $50 billion in market cap and a sustainable high economic growth can produce significantly more number of such companies going forward. For financials, the blessing has been the high GDP growth rate over the last three decades, that enabled this mediocre RoE business (caped at 15-20%) to create significant value for shareholders. Had these financial companies been in Japan, this would not have been the case!
Coming back to Japan, the country’s respectable market cap to GDP ratio reflects the ability of private sector enterprises to triumph the adverse economic challenges and generate income outside of their home country. Imagine what would have been Japan’s market cap to GDP ratio if it had a sizable and vibrant domestic economy as well!
Japan’s market cap is also 2X that of Germany. Germany is an economy that is similar in size to Japan.
So, you see in this case the market cap can be at a premium and grow despite a slow growing domestic economy!
When is a stock market cap > GDP? (And vice versa)
The bottom line from the study of above markets is that stock market need not be an exact reflection of the size of the economy (GDP) or its growth rate. It can be far higher or lower than it. If this be the case, then a simple interpretation of market being over-valued or undervalued may not hold good!
So let us first understand some of the important factors that make the stock market significantly more worthy than the GDP of a country:
- Efficient private enterprises that deliver higher return on capital (RoCE and in turn RoE) resulting in high stock market value creation.
- Ability of enterprises to grow beyond their home country, profitably, can significantly aid in higher stock market valuation relative to the GDP.
- Government policies skewed towards competitive capitalism and NOT towards crony capitalism and socialism can enhance stock market value creation.
An adverse combination of these three can paint a bleak picture to stock market investors, the size of the economy notwithstanding. This is true to some extent in the case of China’s stock market.
Germany’s case is a different one where its dominant private enterprises failed to fetch respectable stock market valuation despite their global dominance and business friendly government policies as the private enterprises in some industries did not deliver high ROE unlike the ones in France.
The lessons for investors looking at the $10-trillion India growth story
India has long enjoyed a healthy market cap to GDP ratio and relatively rich valuation among emerging markets due to high quality companies being part of the index, especially the high RoE private sector financials, IT services and consumer majors. This ratio saw a major take-off post 2002 and has stayed higher since then. Despite some hiccups in banking sector in the previous decade, the large banks are again back with class-leading return metrics. The number of companies with ability to generate business outside of home market will augment value creation, as we saw with IT sector in the past.
As we have seen from our study of market cap to GDP ratio of other major countries, the future value creation in stock market will depend on high quality private enterprises that create value for shareholders.
As Warren Buffett has famously said; “When a management with a reputation for brilliance tackles a business with a reputation for bad economics, it is the reputation of the business that remains intact”.
A classic example for this could be found in Tata Group that is known for leadership excellence but met with mixed results within the group. While TCS turned out to be a crown Jewel, untimely capital allocation into businesses with inferior economics (Tata Motors, Tata Steel, Indian Hotels) have led to inferior value creation in those flagship companies. Tata Motors is a far bigger company than TCS in terms of revenue, but it operates in an industry with reputation for poor economics globally.
Even with conglomerates such as Reliance and L&T, the value creation to shareholders in the last decade has happened by diversifying into businesses with better business economics.
For long term investors planning to profit from the $10 trillion India GDP story the following matter:
- It matters a lot to narrow down on sectors and companies that can create shareholder value. Simply chasing themes and narratives can be deceptive. Even recently as in 2021, investors were deceived by the debut of many new-age tech companies at rich valuations. The largest one of these new-age techs (Zomato) is now worth over $10 billion. Is there a multi-billion-dollar enterprise hiding in this sector? Maybe. There is a hidden giant in Reliance (JIO Platforms comprising telecom, e-commerce, and media assets) whose value may be unlocked only at the time of its IPO.
- There is also lot of expectation built on “manufacturing” as a theme which requires relatively high capital (on fixed assets and working capital) compared to services or consumer businesses. Ascertaining whether they can operate with superior capital efficiency (RoCE) at a larger scale for long term will be key to profiting from this theme.
- We have seen the rise of new $10 - $50bn billion companies emerging in consumer segments such as fashion, Jewellery, retail, etc triumphing the age-old staple players (FMCG) in market cap and demonstrating superior capital efficiency. These may also be the stories that gain traction through the next $6.5 trillion GDP journey. There may be a Zara or Uniqlo hiding here.
Investors can use the observations from other markets on what kind of companies graduated to multibillion dollar enterprises and how they grew. It can be many things - from technology to brands to scale and their ability to tap a larger global market. But ultimately everything must happen with superior capital efficiency (RoCE and in turn RoE) for investors to benefit.
The securities quoted are for illustration purposes only and are not recommendatory.


10 thoughts on “Is the Buffett indicator (Market cap to GDP ratio) the right indicator for stock market valuation? ”
Your observation on Tata putting more capital in steel and auto is very relevant. With further resources getting tied up in Air India , Tata group may be under severe pressure.
Your view on this
Welcome your comments sir,
A decade ago, the narrative was to go global and there was an EM/BRICS narrative as well. So Tata Group board also decided to go with that. Unfortunately that didn’t go well
They had Cos like Trent (Westside, Zudio) & Titan even then which received less attention. But now they are turning out to be new Crown Jewels for the group. CROMA was born very late as well.
I don’t know how Air India buy out will work, but it is good to see that there is significant domestic capital allocation this time. The industry is almost a duopoly with pricing discipline as well at this point of time (Unlike what happened to telecom when JIO entered with price war)
We are also seeing ASK Investment Managers and Ex-HDFC Fund Manager Prashant Jain’s 3P capital making allocation to Indigo Airlines (at advantage if Tata’s maintain pricing discipline).
Even Tata’s have put significant commitment to make Tata Motors an impactful player in domestic passenger car market.
In the next decade, if domestic consumer-oriented businesses outshine for Tata’s, then it should be a very good outcome for the group, resulting from the capital allocation decisions of recent past.
Thank you
Fantastic & brillant article! I am sure lot of thought & efforts has gone in to write it.
Thank you sir
Nice article, also one more parameter that can be checked is listed companies contribution to GDP/ Total GDP of a country. Many a times like today, contribution of listed companies to total GDP in India is increasing post covid at times at expense of small unlisted companies.
Welcome your comments sir
Contribution to GDP is nothing, but the topline/revenue
The bottom-line and RoCE will decide value creation and higher the value creation, higher the M Cap
You are right w.r.t to rising share of organized sector/ listed Cos to GDP. That’s also evident from new consumer franchisees doing well and moving higher the M Cap order.
If that matches with value creation potential of those sectors (High RoCE), then we may see expansion as well to our M Cap to GDP ratio.
Thank you
Thank you for a thought provoking article!
Thank you
Can you please also check for nations like Brazil and Sweden.
Yes, you are right sir.
Brazil has only 3 companies above $50 billion for such a large economy and that too commodity players followed by a dominance of financials in the top 10
Sweden has relatively bigger sized Cos compared to the size of its economy and has produced multi-national Cos as well
It also narrows down to the thought that value creation in stock market will depend on private enterprises and businesses that can create value to shareholders
Thank you
Comments are closed.