In the previous update, where we had given an overall outlook for the Nifty 50 for this year, the expectation was that the Nifty 50 index could get into a downward correction. The immediate target mentioned in that update was 17,150-17,200. The Nifty 50 index came within the striking distance of this target on the Budget-day. The low recorded on February 1 was 17,353 which was not too far away from the projected target zone.
In this post, we shall discuss a brief short-term technical outlook for the Nifty 50 index and some interesting statistics which will be a follow-through to what we discussed in the previous post. Let us get started with the short-term technical outlook.
Short-term Nifty 50 outlook
Let us assess the short-term outlook by taking a look at the daily candlestick chart of the Nifty 50 index.
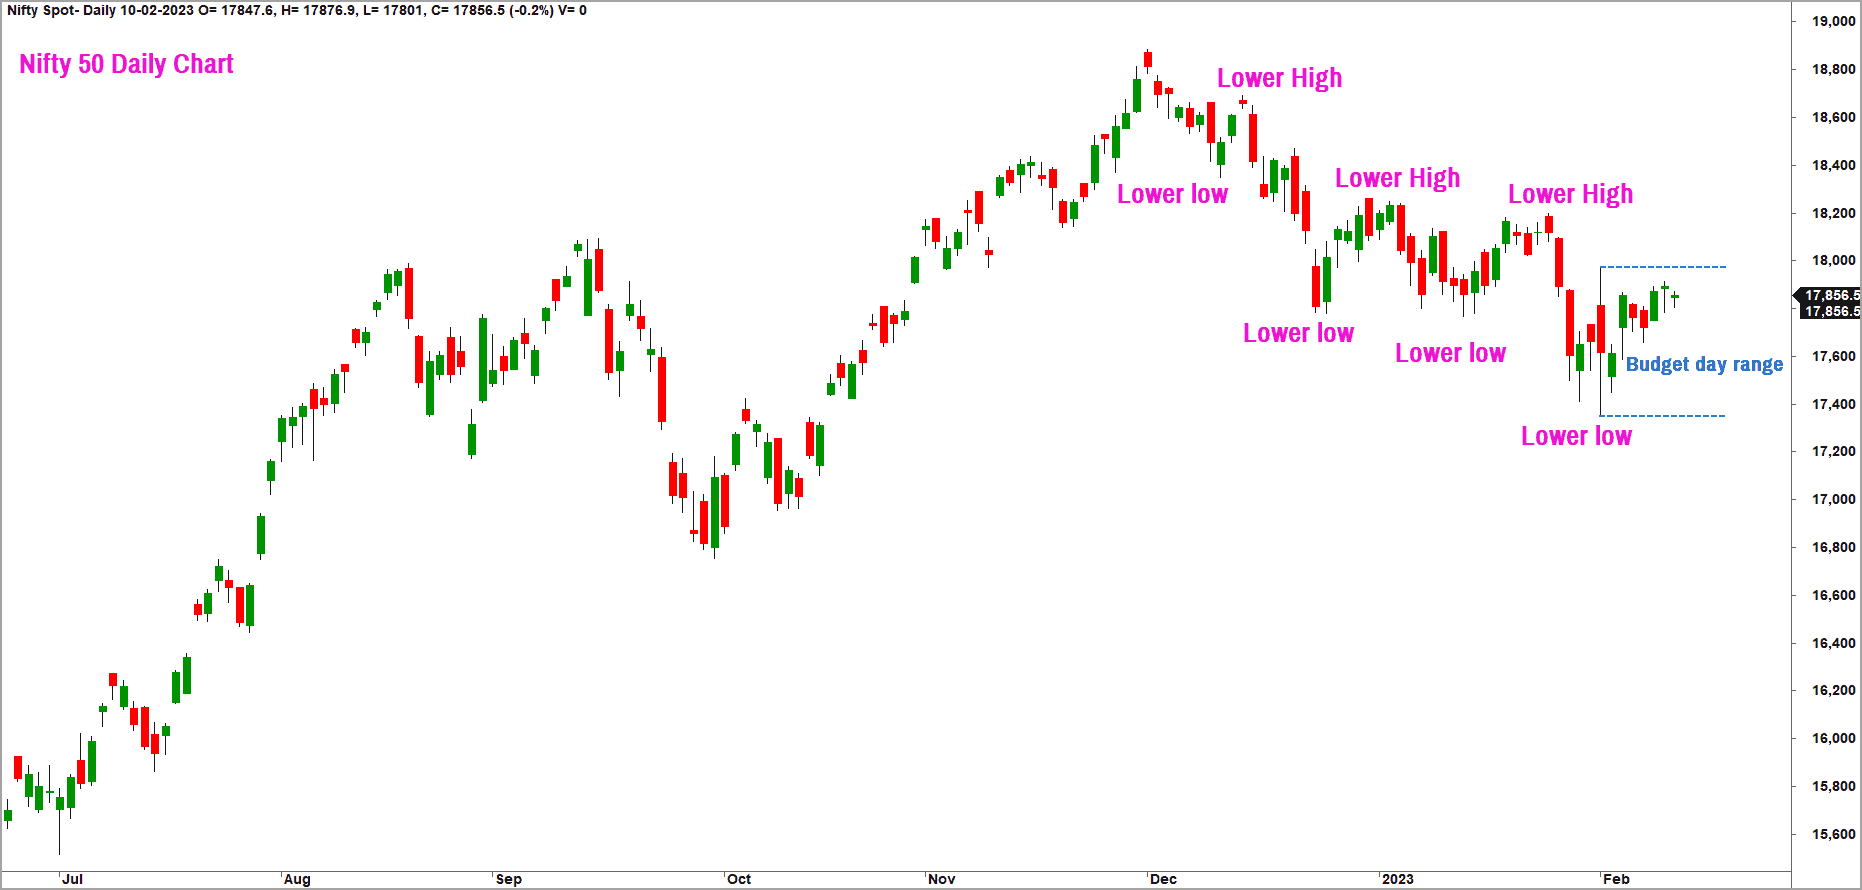
As highlighted in the chart above, the index is tracing out a bearish sequence of lower highs and lower lows. This is a sign that the short-term trend has not turned bullish yet. A move past 18,300 would be a bullish sign as this would break the bearish sequence of lower highs and lower lows.
Above 18,300, the next target could be 18,650-18,700 zone.
On the other hand, a drop below the budget-day low of 17,300 would be a sign of weakness and a drop to 16,700-16,900 cannot be ruled out thereafter. For now, it is difficult to decide which side the breakout would occur. We shall address farther targets on the way up or down in the subsequent posts, based on how the price action unfolds.

A closer look at the recent price action indicates the following:
- That the Nifty 50 index has remained largely rangebound and has been devoid of any trend.
- The daily price range is also shrinking.
- An interesting trend is that the price in the past seven trading days, has been confined within the extremes of the range established on the Budget-day.
The range-bound price action along with the shrinking of the daily range is a sign of indecision among the market participants. Hence, a breakout above 18,300 or below 17,300 would set the tone for the next big move in the Nifty 50 index.
Any market outlook would be incomplete without studying the breadth indicators. The PF-X% based breadth indicator that we track closely is in the neutral zone across the short, medium-and long-term time frames. This might be a comforting factor for the bullish camp.
While the breadth in the long-term time frame was a cause of concern in the prior months, it has now cooled off from the overbought zone and is hovering at 72%. This reading, however, is not too far off from the overbought zone of 75%. And, the breadth is yet to cool off from overbought to oversold zone. Hence, there is a possibility of a downside breakdown in Nifty 50 but let us wait for confirmation.
Broader markets
Now, let us take a quick at the broader markets. Here is the short-term breadth chart of the Nifty 450 stocks (Nifty 500 index minus Nifty 50).
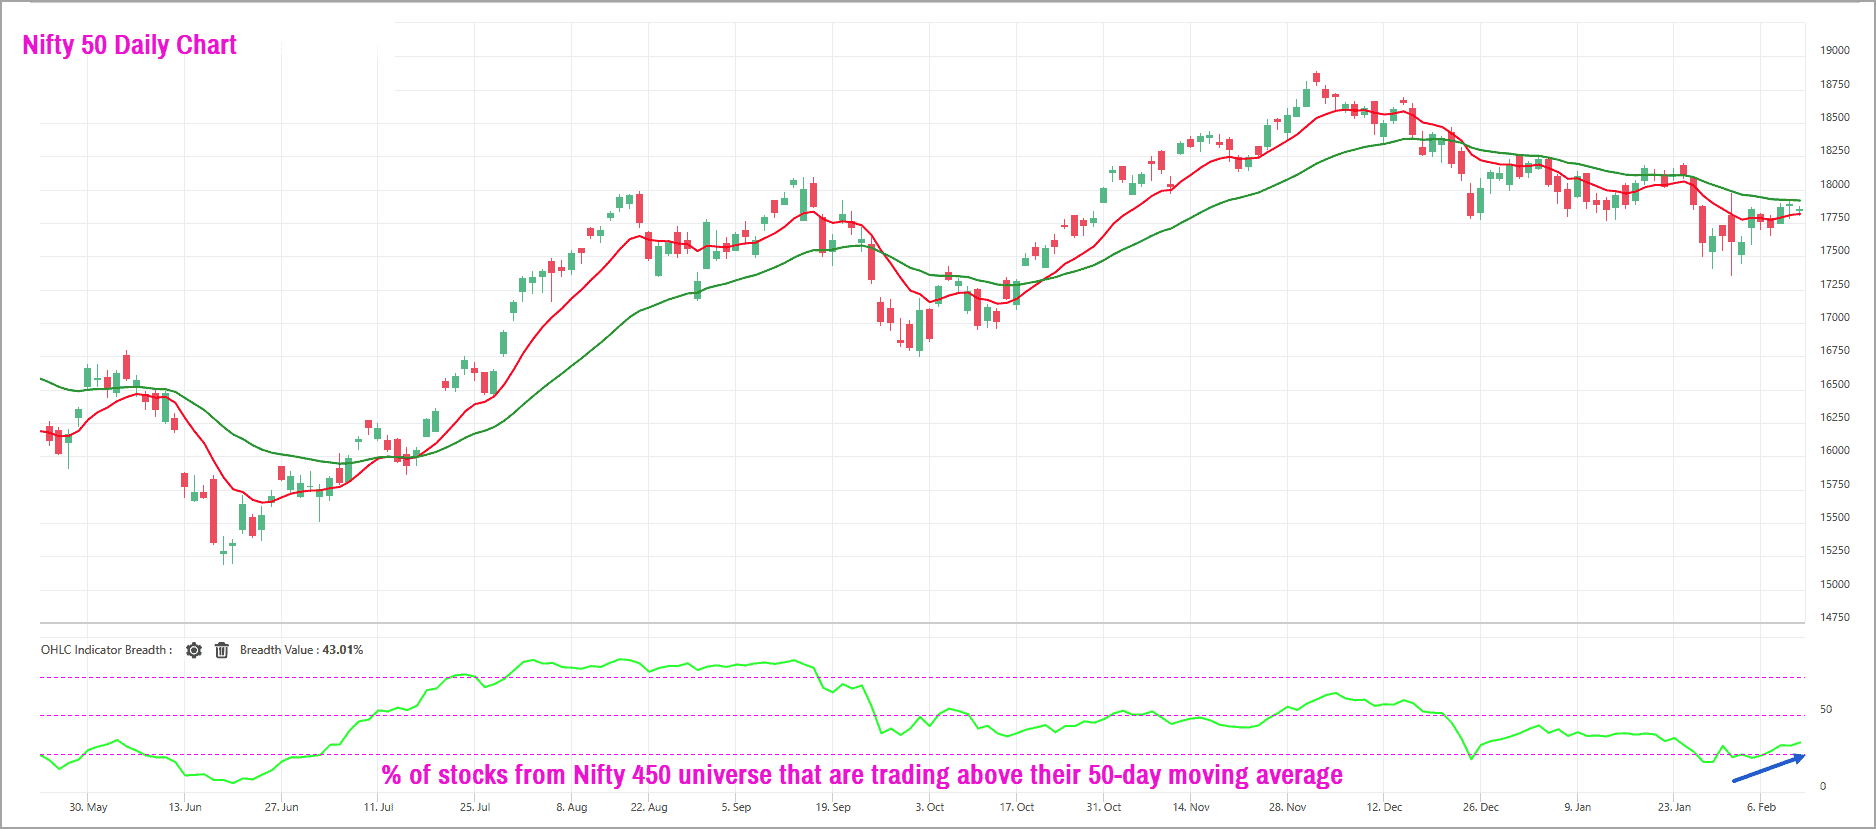
While the Nifty 50 index has not seen much traction recently, there seems to be signs of buying interest creeping into the broader markets. This is evident from the improvement in the percentage of stocks that are trading above their 50-day moving average. This indicator is plotted in the lower pane in the chart above.
This indicator is a short-term breadth indicator, and the improvement suggests that there are early signs of buying interest percolating into the stocks outside of Nifty 50 universe. This is just an early sign – or green shoots, if you want to call it that. We must await clear signs of buying interest and outperformance of the Nifty MidSmallCap 400 index versus Nifty 50 before considering exposure or enhancing exposure in the broader markets. So, keep a watch on this segment! We will also update our observations when there is confirmation in this regard.

Another data study
In the previous post, I had highlighted the tendency of the Nifty 50 index to get into a drawdown in excess of 10% in majority of the calendar years. As a follow-up to this, I wish to share another interesting data point this time.
Here is the annual return of the Nifty TRI index since the year 2000.
It is evident from the above data that the Nifty 50 index has delivered positive returns in 18 out of the 23 years. This kind of a positive yearly return is also evident in the US markets where there is more historical data to support this observation.
We can build an interesting investment strategy if this data is juxtaposed with the drawdown details mentioned in the previous post. Given that the Nifty 50 index has this tendency to deliver positive yearly returns, would it not make sense to consider lumpsum investment in the index whenever there is a sharp fall? By doing so, the yearly returns can be much better than what is captured in the above data.
The key question now could be how one defines a sharp fall, or when does one decide to deploy lumpsum investment in the index. To make this process more objective, I wish to present yet another data point.
We shall use the medium-term breadth indicator as a tool to time our yearly lumpsum investment. As always, we will use the PF-X% breadth indicator. This indicator captures the percentage of stocks that are in a bullish swing in the 3%-box size Point & Figure chart. The PF-X% indicator in the 3% box size would capture the breadth in the medium-term time frame.
Have a look at the data presented below. It captures the lowest value of the medium-term breadth recorded in each calendar year. Just to clarify, reading below 25% is considered oversold and above 75% would be considered as over overbought zone. Anything in between 25% & 75% would be neutral zone.
It is clear from the above data that the medium-term breadth indicator drops to oversold zone in almost every year. In the last 24 years, the medium-term breadth has dropped below 25% (oversold zone) on 22 occasions. It did not reach the oversold zone only in 2012 and 2019.
These are the statistical observations from the data we have studied in the last two posts:
- Nifty 50 index has the tendency to get into a drawdown of more than 10% in most years.
- Nifty 50 index still does deliver positive yearly returns in majority of the years.
- The medium-term breadth indicator hits the oversold zone almost every year.
Putting these things together, my strategy is to invest lumpsum in Nifty 50 index (either through an index ETF or Index fund) whenever the medium-term breadth gets into the oversold zone. This indicator was extremely overbought at 97% in August 2022 and has since been cooling off. It is currently at 40% and is yet to move into the oversold zone. A drop to the oversold zone in this indicator could present a nice investment opportunity.
Sector highlights
Before winding up, I wanted to highlight a few sectors that are showing a lot of promise and relative strength versus the Nifty 50 index. The Nifty PSU Bank Index has been in a correction and underperforming in the recent weeks, but this still remains an interesting sector to focus on. The other interesting sectors include Nifty IT, Nifty Auto and Nifty FMCG.
While the Nifty FMCG & Nifty Auto indexes are displaying considerable strength and trading near their all-time highs, the Nifty IT index is setting up well and could be the sector to track closely for potential investment opportunities.


13 thoughts on “Technical outlook: Outlook now for the Nifty 50”
This article’s last para is in somewhat contradiction to the “Stock Market Mood” tool. The tool says “great time to invest” while your article in someway indicate that Nifty is yet to move into the oversold zone.
Which one should we use to make a decision?
The Nifty VMI uses momentum (that is the only technical part) and primarily fundamentals. Technical outlook entirely use different chart techniques and is for the very short term.
Dear Mr. Krishnakumar
Thank you for the article. It would be great if you could do a simple back test of the strategy that you so beautifully explained for > 2, 3, 5 years investment timeframe in Nifty50 ETF. It would help potential investors who are sitting on the sidelines to make a judgment to enter the market.
Hello:
To share the results of a back test study, we need to define the exit criteria. What I have highlighted is just one side of the equation which is the entry aspect. I have suggested an objective method to deploy lumpsum money in Nifty. The idea is to hold these for long-term, unless there is some emergency. But, if you want to treat this as a trading or short-term investment strategy, then you may consider exiting when the medium term breadth reaches the overbought zone. The other option is to exit when there is X% returns. For example, this X% could be when the returns are more than the prevailing 1-year fixed deposit returns. Am just giving you some ideas.
Hope this helps.
B.Krishnakumar
Could you please indicate what levels of Nifty is 10% draw down. and if on such levels we can enter lumpsum?
Thanks, Do alert us once Nifty reaches the oversold territory, thanks again
A really nice article Krishnakumar. Can you pls let me know what is the ideal time period for monitoring RSIs ( 14 day 1 month , one year etc) for various indices (Nifty 50 , Bank Bees etc.) considering a lead time of 3-6 months between buying and selling in order to maximise the XIRR ?
Hello:
I have not done any back-test or analysis using the RSI Indicator. More than RSI (which is price based study), I would recommend any breadth indicator which I feel is more apt to assess market sentiments. Any breadth indicator may be used to time your lump sum investment decision. There are host of breadth indicators such as percentage of stocks trading above a certain moving average or even % of stocks trading below the 30% level in 14-day or 10-week RSI.
You can give these a thought.
Regards
B.Krishnakumar
Good article Mr. Krishnakumar Thankyou.
Can you please tell which charting software you are using for the charts shown in the article.
Hello:
I have used Amibroker software for the candlestick chart. The breadth data is extracted from the TradePoint software from http://www.definedge.com. You will soon get the breadth data in the Primeinvestor portal. It should be available soon. The annual Nifty returns data is widely available online.
Regards
B.Krishnakumar
Thank you, Krishnakumar.
Any suggested sites to track the medium term breadth indicators.
Hello:
We will soon introduce a separate section in our portal where the breadth across different time frames will be updated regularly. So, stay tuned!
Thanks
B.Krishnakumar
Thanks Krishnakumar. Eagerly waiting for medium term breadth indicator to be published.
Comments are closed.