![]() In our previous post on the Nifty 50 outlook, we had mentioned that the short-term technical outlook for the index was positive and that the index could head to the 18,000-18,300 range. This view played out and the Nifty 50 index hit a high of 18,350 on January 18 and has since been on a downward trajectory.
In our previous post on the Nifty 50 outlook, we had mentioned that the short-term technical outlook for the index was positive and that the index could head to the 18,000-18,300 range. This view played out and the Nifty 50 index hit a high of 18,350 on January 18 and has since been on a downward trajectory.
Let us again focus just on the short-term outlook for the Nifty 50 index as the long-term outlook remains unchanged. Refer to this link to read our long-term outlook.

Nifty 50 short-term technical outlook
To assess the short-term outlook, let’s use the 1% brick size Renko chart. Have a look at the chart displayed below.
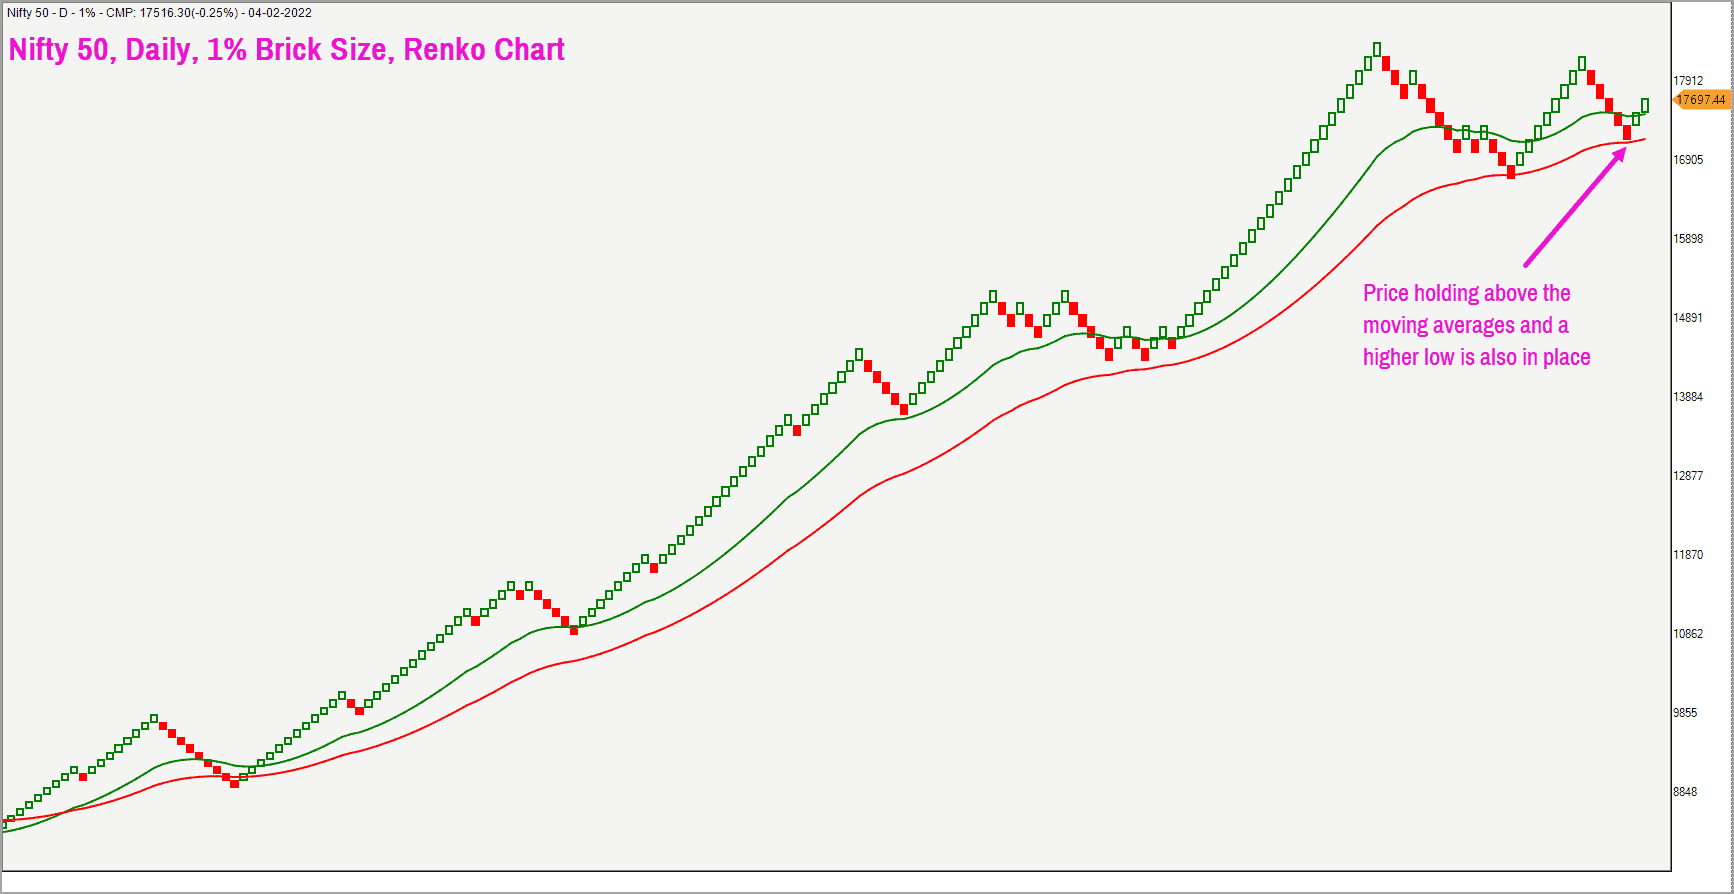
If you notice the chart, you will see that the price is trading above the moving averages and this is a positive sign. As highlighted in the above chart, a higher swing low is also completed which is a bullish sign. Also, the recovery off the January 25 low has been accompanied by a recovery in the breadth, measured by the PF-X%. The PF-X% indicator captures the percentage of stocks that are in a bullish swing in the Point & Figure chart.
The recovery in price backed by an improvement in the breath is a healthy sign, suggesting widespread participation of stocks from the Nifty 50 universe. Let us also study the breadth indicator based on candlestick charts. The percentage of stocks trading above their 50-day moving average has also recovered from 36% on January 24 to current levels of 58% confirming wide-spread participation of stocks in the recent recovery.
The price action and the breadth suggest short-term bullishness. The immediate target for the Nifty 50 index is 18,250-18,350. The bullish view and the targets would be invalidated if the price falls below the January 25 low of 16,830.
Sector-wise, Nifty Bank, Nifty Metal and Nifty Healthcare look promising. Nifty FMCG is showing some promise, but we need more confirmation. So, keep a tab on the FMCG sector as it has potential to spring a positive surprise.
The Nifty IT index has taken a drubbing recently. It is better to avoid aggressive exposures until there are signs of bullish momentum returning to the sector. A drop below 33,300 in the Nifty IT Index would be a bearish sign and could open up possibilities of a slide to 28,000-28,500.
Though the Nifty IT index has bounced off the January 27 lows, the recovery has not translated into improvement in the sector breadth. Hold on to your exposures in the IT sector but avoid fresh exposures as price in the relative strength chart has also turned bearish in the short-term.
Let us wait for concrete signs of recovery in the price as well as relative performance chart before taking fresh exposures in the sector. A breakout past 39,000 is required to invalidate the short-term negative view on the Nifty IT index.
Having said this about the Indian IT sector, we thought we should also take a look at a global tech-heavy index that has been in news this year for a steep correction. We are talking about the Nasdaq 100 index. Besides the correction, this is also an index widely owned by Indian investors through mutual funds and ETFs and is therefore of interest to those who hold them. Let us look at what the charts hold for this index. (please note that the restrictions on investing in international funds in India continue for now. You can get updates on the same in this article).
Nasdaq 100 Index
The Nasdaq-100 includes the top non-financial companies listed in the Nasdaq. It is heavily allocated towards top performing industries such as technology, consumer services, and Health Care. We shall try to assess the short-term and medium-term outlook for this index.
Let us take a quick look at the weekly chart of the index to study the broad trend and the short-term and medium-term outlook.
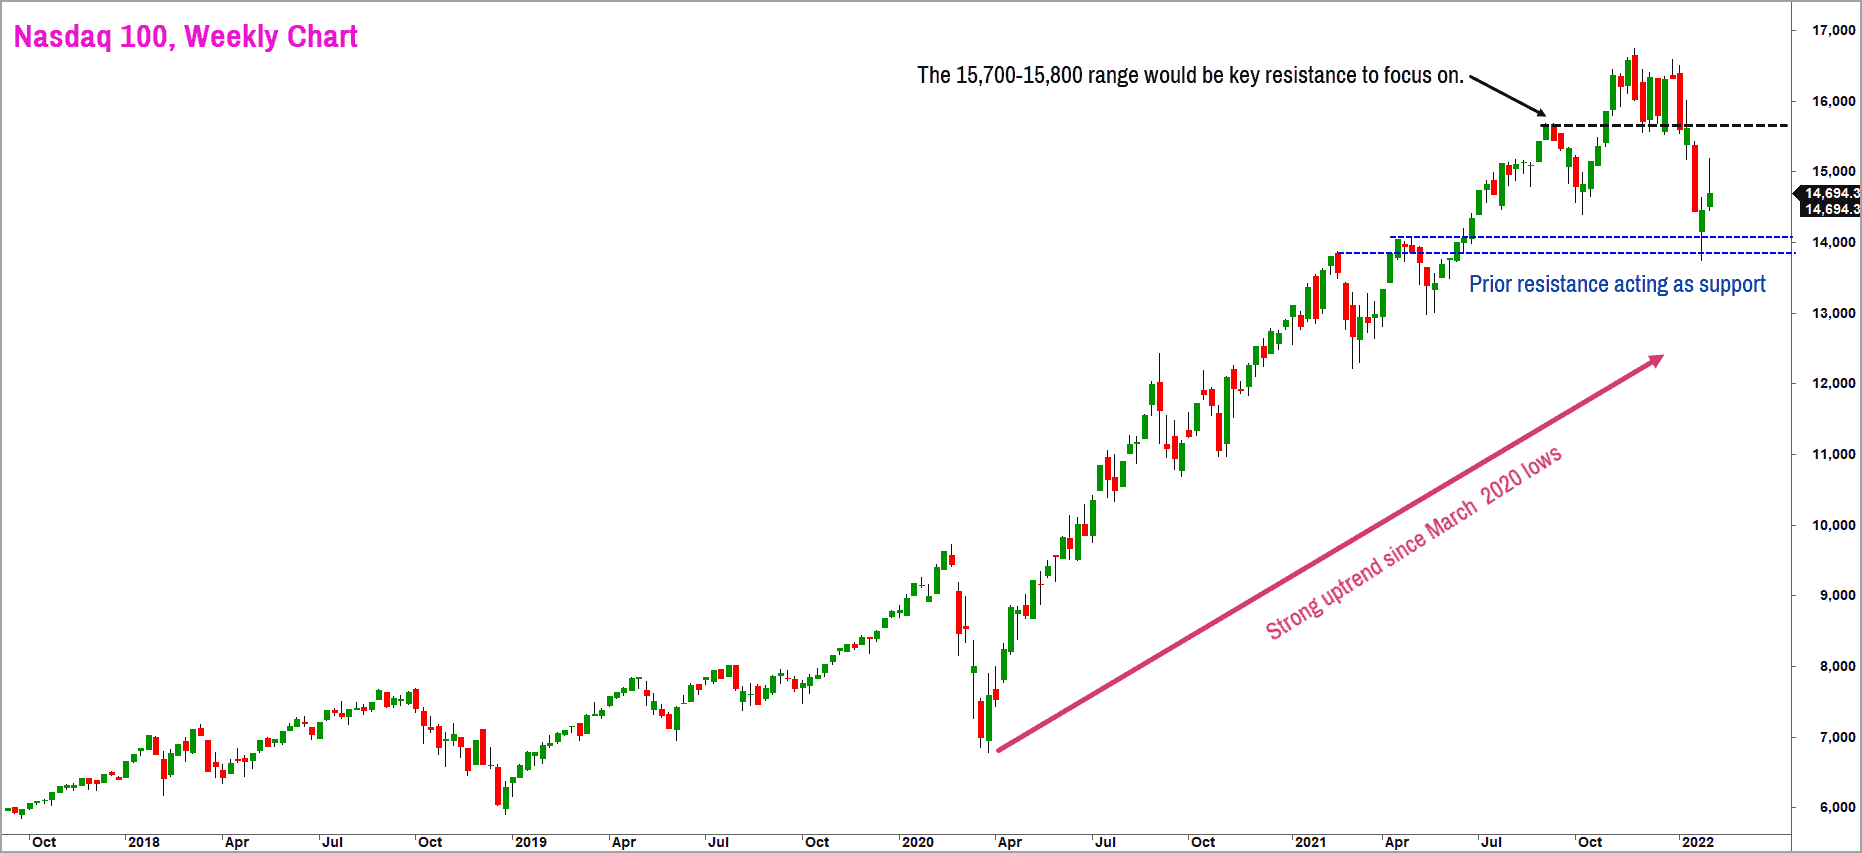
As highlighted in the chart, the price has been on a strong uptrend since March 2020 lows. This index gained 148% from the March 2020 low of 6,772 to touch a high of 16,765 in November 2021. After a brief consolidation until the end of December, the index has since dropped sharply.
The bullish sequence of higher highs and higher lows has been violated in the recent fall and the price has breached the swing low at 14,384 recorded in October 2021. While the breach of prior low is a sign of weakness, it is positive to note that it has bounced off the prior resistance and this is now acting as the support.
Given the recent sharp fall, there is a case for the price to consolidate in a trading range in the near term. The key levels to watch would be 15,700 on the upside which is the erstwhile support which will now act as a resistance. On the downside, the 13,900-14,100 zone would act as support. A move past either of these two levels would set the tone for the next big move in the Nasdaq 100 index.
In order to get some clues above the likely direction of the breakout, let us also have a look at the 3% brick size Renko chart of the Nasdaq 100 index. This chart provides a long-term overview of the trend.
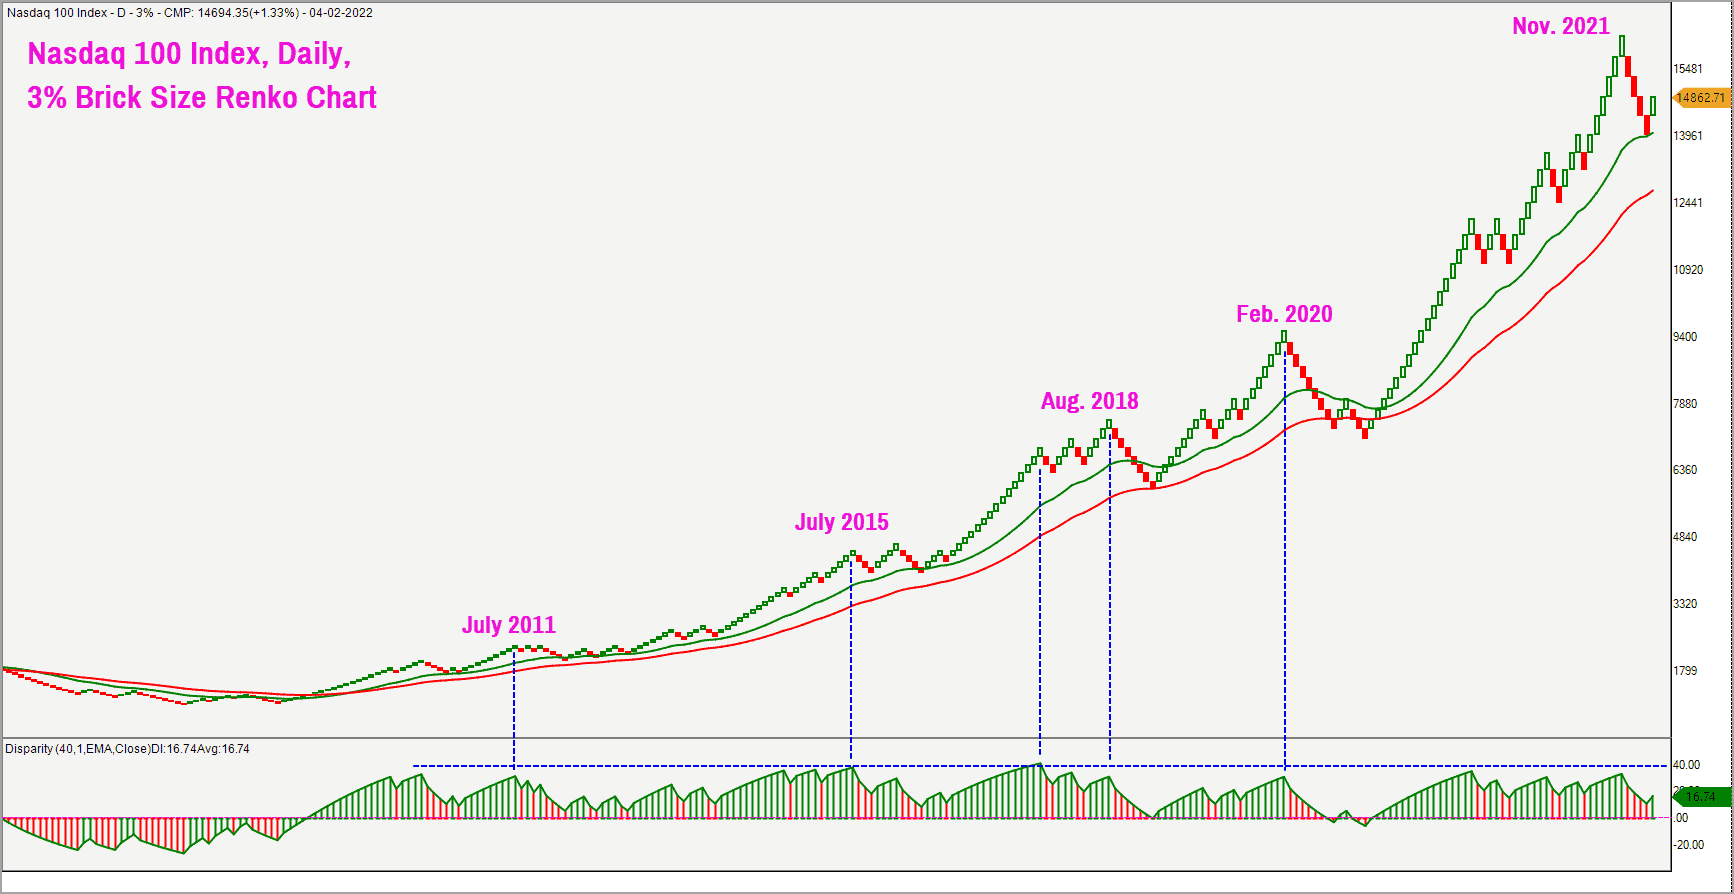
The Disparity Index indicator is plotted in the lower pane in the above chart. This indicator measures the percentage distance between the current price and the 40-brick exponential moving average. This indicator is a reliable tool to measure how overbought or oversold prices are in relation to its mean.
The Disparity Index in November 2021 reached extreme zones from where price has displayed the tendency to revert to the mean. This mean reversion or cool off from extremes is still at play and the expectation is further cool off in price in order to bridge the gap between the price and the red coloured 40-brick exponential moving average.
A quick vertical count calculation in the Point & Figure chart of the Nasdaq 100 chart projects a downside target of 12,350-12,400. A drop below the immediate support at 13,900 would confirm the possibility of a drop to this target zone.
Until the Nasdaq 100 index moves past the resistance zone at 14,100, it would be advisable to operate on the premise that the price would drop to the target zone mentioned above.
Ongoing SIPs in this index or any tech-fund need not be disturbed based on the observations in this post. If you are planning a lumpsum investment, then the suggestion is to wait for some time until the expected volatility and the likely downside move plays out.


6 thoughts on “Technical outlook: Nifty 50 and Nasdaq 100 in focus”
Krishnakumar….Quick Q….y’day’s Nifty close at 16814 is marginally below the level of 16830 (Jan 22 low, Lakshman Rekha). Does this mean, your bullish view on Nifty is negated or is it to be assumed as weekly close or some other parameter that will stop the race to nifty 18250-18350? Thx
Hello:
Given the velocity behind the reversal today, I would not consider the breach of the level as valid yet. A close below yesterday’s low would be more meaningful now. But, remember, my long-term view is either a correction to lower levels or volatile sideways price action. The basic requirement is the bridging of the gap between the price and the moving average in the bigger time frame charts.
Let’s wait and watch. We will keep you updated regularly. Best Wishes.
B.Krishnakumar
How about a beginner friendly series on learning about Technical Charts for the uninitiated like me?
Hello:
Appreciate your interest towards learning technical charts. We shall think about it. If we find it feasible and more importantly if a bunch of readers are equally eager, we can think about doing some kind of a primer on chart reading & decision making using simple tools.
Regards
B.Krishnakumar
slowly every article is now being reserved for growth subscribers. You could as well have increased the subscription rates for everyone !
Technical analysis has always been part of the Growth plan. Features under the Growth plan were offered free for Essentials subscribers until Dec 31 2021, when we launched Growth in Jan 2021…we have been clear about this from the start. For any clarifications on what is available under each plan, please write to [email protected]. – thanks, Bhavana
Comments are closed.