The Nifty 50 index moved within the striking distance of the target zone of 20,250-20,300 mentioned in the previous update. After scaling a high of 19,992 on July 21, the index has since been in a corrective mode. The key question now is – has the index topped out? And is there further downside possibility in the short-term?
We believe it is premature to address the first question. So, we shall focus on the short-term outlook along with the prospects of a few sectoral indices. Let us get started with the short-term outlook for the Nifty 50 index.
Short-term outlook
As always, we shall begin with a look at the daily candlestick chart of the Nifty 50 index.
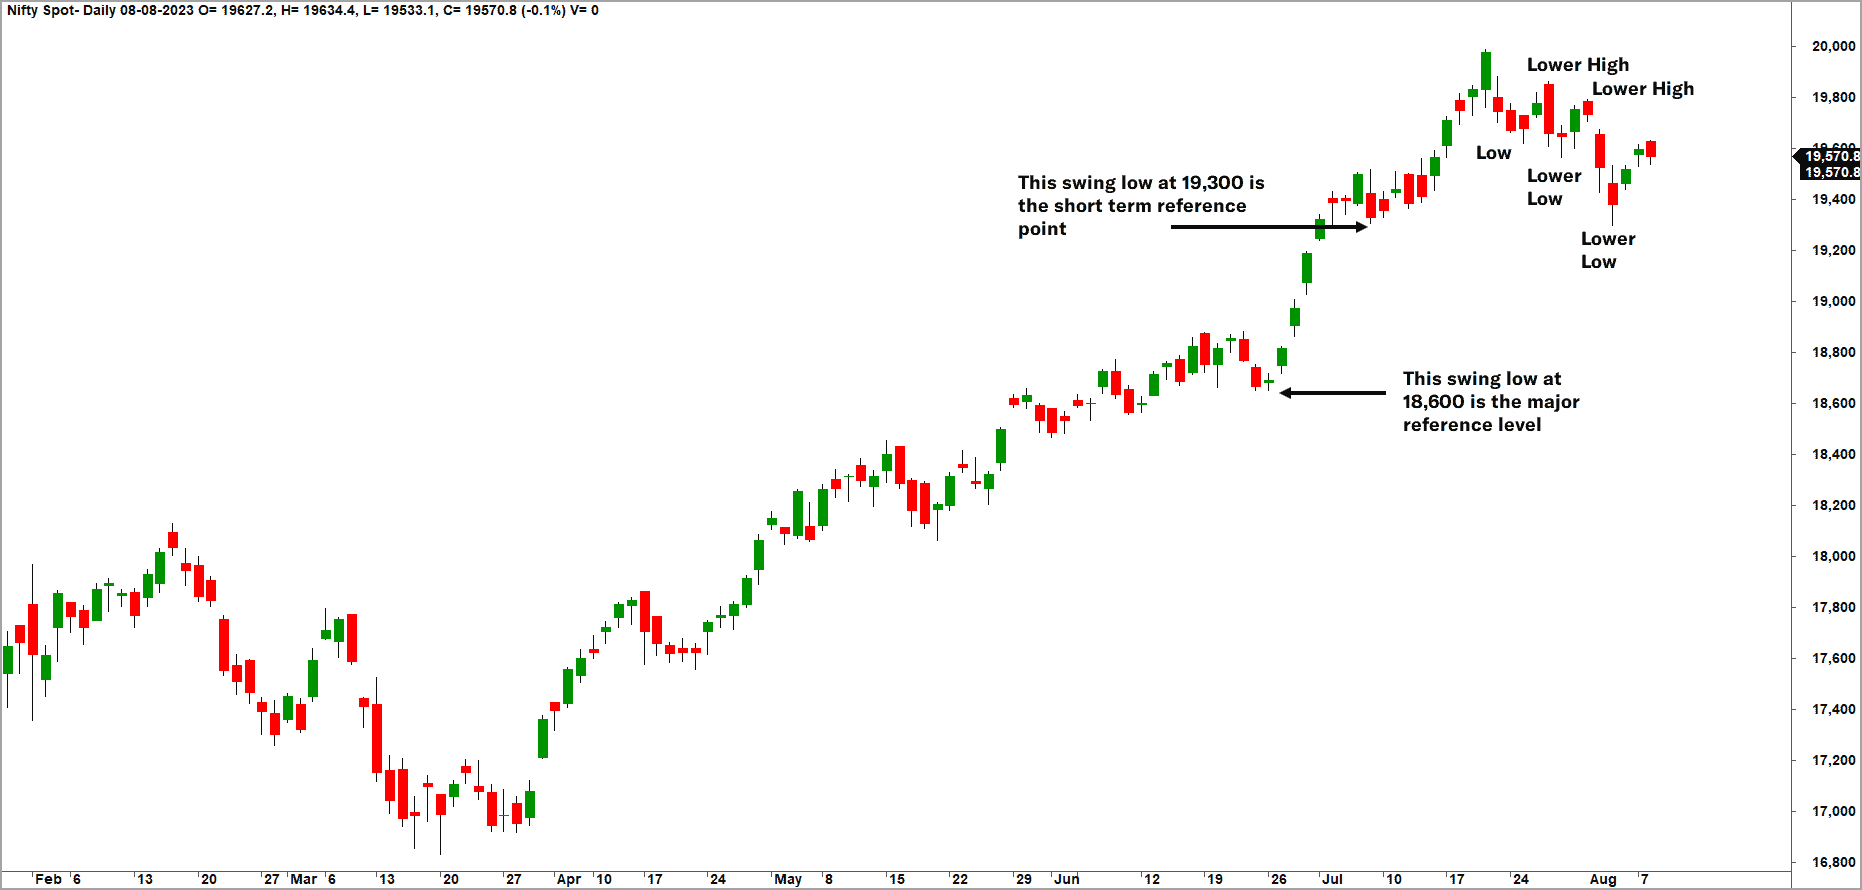
As highlighted in the chart above, the price is tracing out a bearish sequence of lower highs and lower lows. This recent weakness is not surprising if viewed in the context of the red flags highlighted in the prior updates.
We had pointed out that the breadth indicator is extremely overbought across multiple timeframes. The recent pull-back has helped ease the overbought condition in the short-term time frame. But the medium and long-term breadth indicators are still at overbought zone, suggesting the possibility of a correction or consolidation to persist.
We use our trusted PF-X% indicator to assess breadth across time frames. This indicator tracks the percentage of stocks in a bullish swing in the Point & Figure chart. In the short-term, this indicator dropped to a low of 30% and is now at 44%. In the medium and long-term, this indicator has a reading above the 90% mark, suggesting an overbought condition.
A word of caution at this juncture, this, will not be out of place. Theoretically, the breadth can remain overbought for several weeks or months, but it cannot remain overbought forever. And almost all major corrections/ trend reversals have been preceded by an overbought breadth reading across multiple timeframes.
From a price action perspective, the swing low at 19,300 is a reference point to pay attention to. A breach of this level would strengthen the case for the continuation of the recent fall. On the contrary, a close above 19,900 would be a sign of strength and could push the index to the 20,400-20,500 zone.
Looking at the recent price action and the breadth reading, there is a stronger case for continuation of the recent fall. But let us await confirmation from price action before jumping to a clear and firm conclusion. A close below 19,300 could open up further downside extending up to 18,750-18,800.
As observed in the previous update, the overall trend would remain bullish until the index drops below the key support level at 18,600. As long as this level is not breached, expect the Nifty 50 index to reach our target of 20,350-20,400.
Other factors
Seasonality-wise too, we are headed towards a phase where the Nifty 50 index has historically displayed weakness and consolidation rather than a strong uptrend (see table below). A look at the data since 2007 suggests that except in the months of August & October, there is a strong probability of the index delivering negative returns in November & December. The historical performance in September has been 50-50 suggesting no definitive trend. If the Nifty has to rally, the seasonality factor tailwind would assist in the current month and perhaps in October as well. The last two months of the year and January have not been historically bullish.
Here is the table summarising the seasonality of Nifty 50 index since 2007.
But don’t rely completely on this factor alone. Remember, these are statistics that simply offer some perspective. We are dealing with probabilities here and there is always a case for exceptions to happen while dealing with a probabilistic study. A classic example is October 2008 when the index crashed sharply though seasonality-wise, October is a month where Nifty has tended to close in the green more often than not.
Along with the price study mentioned above, the negative divergence between the price action and the DMA histogram indicator that was pointed out in the previous update is still prevalent. A fall of 5-6% in the index would confirm the negative divergence and its bearish impact.

The intention behind the past few updates is not to create panic but to highlight concerns so that one is better prepared for a deeper correction, if it were to happen anytime soon.
Other interesting indices
Nifty Bank Index
Let us now turn to sectors. There are a few interesting developments. Let us begin with the most influential Nifty Bank index.
As highlighted in the past few updates, the Nifty Bank index remains a relative underperformer, which is major cause of concern. Banking stocks have a significant weightage and influence on how Nifty 50 index behaves. Theoretically, Nifty Bank index can continue to underperform while both indices seek higher levels. This can happen if the Nifty 50 index rises at a faster clip than the Nifty Bank index. We, in fact, are witnessing such a scenario since June 26. This scenario cannot however persist for long; it is analogous to driving a vehicle either with an underpowered engine or with constantly dropping fuel reserve.
As highlighted in the previous update, a fall below the 43,000-mark would be an early sign of the onset of a short-term correction in the Nifty Bank index. Keeping close tabs on the price behaviour and the relative performance of this index would offer interesting insights about what is in store for the Nifty 50 index.
Nifty MidSmall Cap 400 index
The most interesting aspect of the rally since the March lows is the strong participation of the broader markets. The Nifty MidSmall Cap 400 index has been a strong performer and this index has also reached the target of 13,100 mentioned in the previous update. The short-term trend remains bullish, and the index could head to the next target at 14,500-14,700. This view would be invalidated if the index closes below 12,000.

Other sectors
There has been an interesting sector rotation at play that is evident in the past few months. For example, the Nifty Bank index, which started off as a strong performer since the March lows, has turned into a relative underperformer in the past several weeks.
On the contrary, the Nifty Pharma index that started off as a relative underperformer, has morphed into a strong outperformer, especially since July 20 when the Nifty 50 hit a peak and commenced its correction. It may be recalled that we had highlighted the turnaround and the stellar performance of the pharma index in the previous update. This index has since gained from strength to strength and has displayed good performance.
The short-term target for the Nifty Pharma index is 16,500-17,000. The recent spike has pushed the Nifty Pharma index to short-term overbought zone. Hence, a consolidation or correction is not ruled out in the short-term. However, until 14,300 is breached, we would expect a rally to 16,500.
Have a look at the relative performance chart of select sectors since March 28, 2003, when the Nifty 50 index had bottomed out.
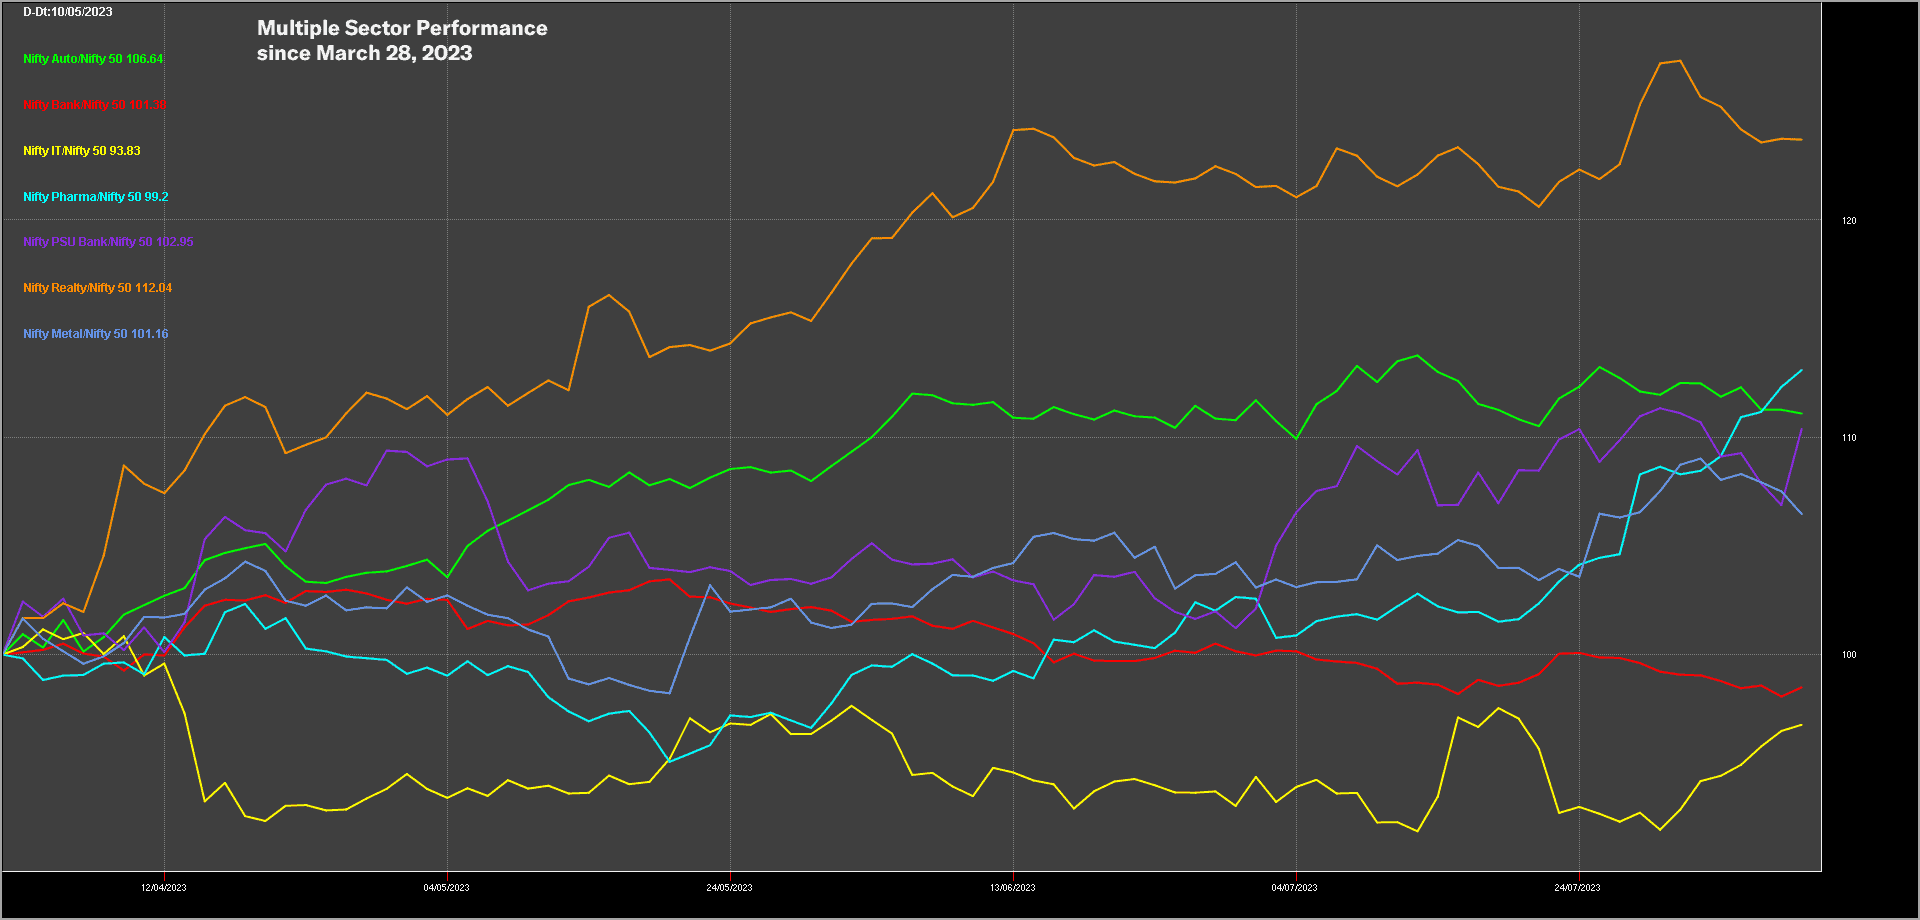
Apart from the Nifty Pharma index:
- The Nifty PSU Bank Index and Nifty PSE index have been strong outperformers in the past few weeks.
- The Nifty Realty Index still remains at the top, indicating relative strength. But the performance line in the above chart has been sloping down in the past few weeks suggesting short-term underperformance. Keep an eye on this sector as it could spring a surprise if the Nifty 50 index were to witness a euphoric spike up.
- The Nifty Auto index is in a consolidation phase. The Nifty FMCG index (not displayed in the chart above) has been losing ground on a relative performance basis.
- The Nifty Bank index (red line) has dipped below the 100-mark, suggesting relative weakness and underperformance. The Nifty IT index remains an underperformer and it is advisable to stay light on this sector until there are signs of improvement in price action and relative performance. Remember, the Nifty IT index is a proxy for large cap IT stocks. There are a few select small and mid-cap IT stocks that have performed well. It would not hurt to pick a few from that space.
To sum up, there are emerging concerns pertaining to the frontline Nifty 50 index. However, the mid and small cap indices and stocks are not affected by the recent weakness in the Nifty. This is a positive sign and suggests that one should focus on quality names from the broader markets in order to generate alpha. The Nifty 50 index is likely to remain in a corrective/ consolidation phase until the breadth cools off.