In the past couple of posts on the Nifty 50 outlook, we have been voicing a bearish view for the Nifty 50 index. This has played out as per expectations. The index almost achieved the first target of 17,150-17,200 that was mentioned a couple of posts ago. In the previous update, we had mentioned the possibility of a slide to the 16,700-16,900 zone.
Let us assess if this target is likely to be achieved or not.
Short-term outlook
Featured below is the daily candlestick chart of the Nifty 50 index.
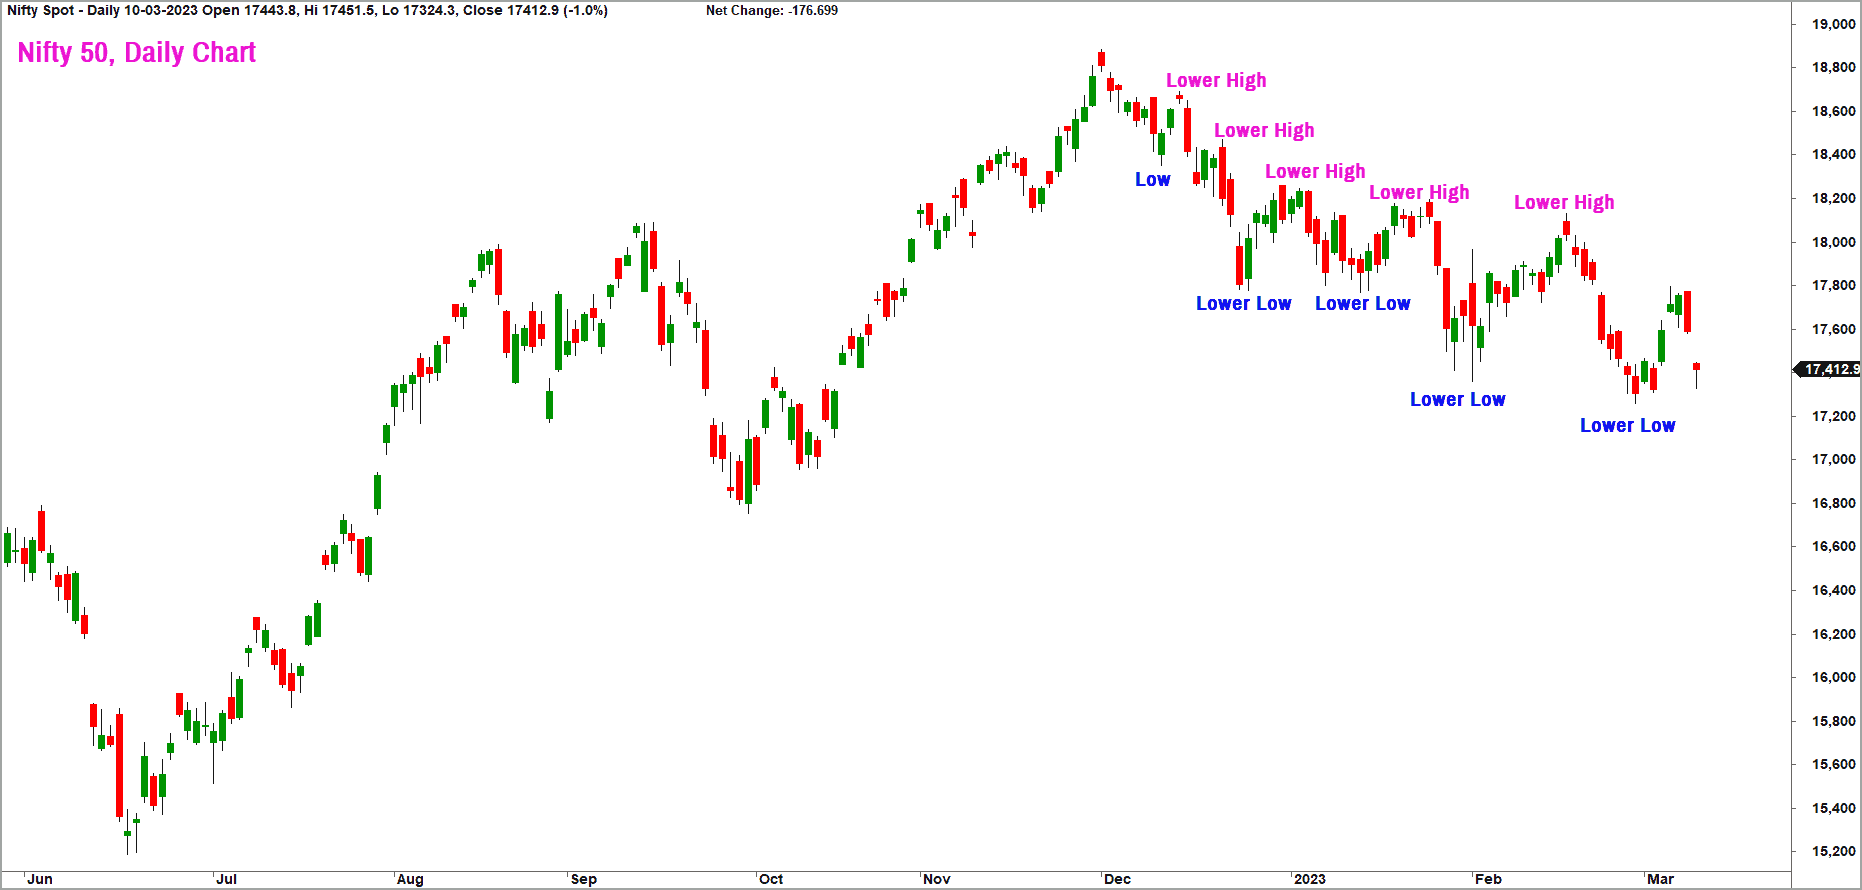
As highlighted in the chart above, the index is still tracing out a bearish sequence of lower highs and lower lows. This is a sign that the short-term trend has not turned bullish yet. A move above the recent swing high at 18,150 would be a bullish sign as this would result in the completion of a higher high pattern.
On the other hand, a fall below 17,200 would result in the continuation of the bearish sequence of lower highs and lower lows. This would also strengthen the case for a slide to the short-term target zone of 16,700-16,900.
We shall discuss farther targets on the way down in subsequent posts based on how the price action unfolds. Similarly, any upside target will be addressed if the need arises.
But let’s get back to the continuation of the downtrend. As always, let us look at breadth indicator to understand if they are supportive of the downtrend. We shall stick to the PF-X% based breadth indicator that we track closely. This indicator tracks the percentage of stocks in a bullish swing in the Point & Figure chart.

Breadth indicators
We will use the PF-X% indicator in 1% box size to study the short-term breadth. This breadth indicator reached the oversold zone at 16% on February 27 and has since recovered to the present level of 40%. The short-term breadth is in the neutral zone and is no longer oversold. Hence, the short-term breadth is supportive of the continuation of the recent downtrend.
On the previous occasion, the short-term breadth indicator reached the oversold zone on December 24, 2022 and scaled all the way back to reach the 74% mark. However, this recovery in the breadth did not translate into bullish price action for the Nifty 50 index. Though the breadth recovered from the oversold zone to reach within striking distance of the overbought zone, the Nifty 50 index could still not complete a breakout above the prior high. This is classic sign of negative divergence, suggesting underlying weakness.
The medium-term breadth indicator, which was discussed extensively in the previous update, is yet to complete its downside cycle. It has cooled off from the overbought zone but is yet to reach the oversold zone. This is another factor strengthening the case for a slide to the short-term target mentioned above.
Nifty Bank Index
With the main market index done, let’s move to some sector indices and see where they are from a technical standpoint. The banking sector plays a key role and acts as a proxy for the economic growth and influencing the trend in the Nifty 50 index. Given the considerable weightage of banking and financial services stocks in the Nifty 50 index, the Nifty Bank index plays a pivotal role in influencing how Nifty 50 behaves. Historically, any trending moves in either direction has been spearheaded by the Nifty Bank index.
Unfortunately, the Nifty Bank index is not displaying signs of bullishness yet. However, this index is still within the price range recorded on Budget day. While the Nifty 50 index has breached the Budget-day low, the Nifty Bank index is still confined to the broad range of 39,400-42,020. While this is a reasonably wide range, a breakout from this range would set the tone for the next big move in the Nifty Bank index and consequently in the Nifty 50 index as well.
A fall below the lower end of the range at 39,400 would be a major sign of weakness and this could push the Nifty Bank index to the next target of 38,000-38,500. Only a move above 41,700 would indicate the possibility of bullish move in this index.
Featured below is the ratio chart of Nifty Bank index versus the Nifty 50 index.

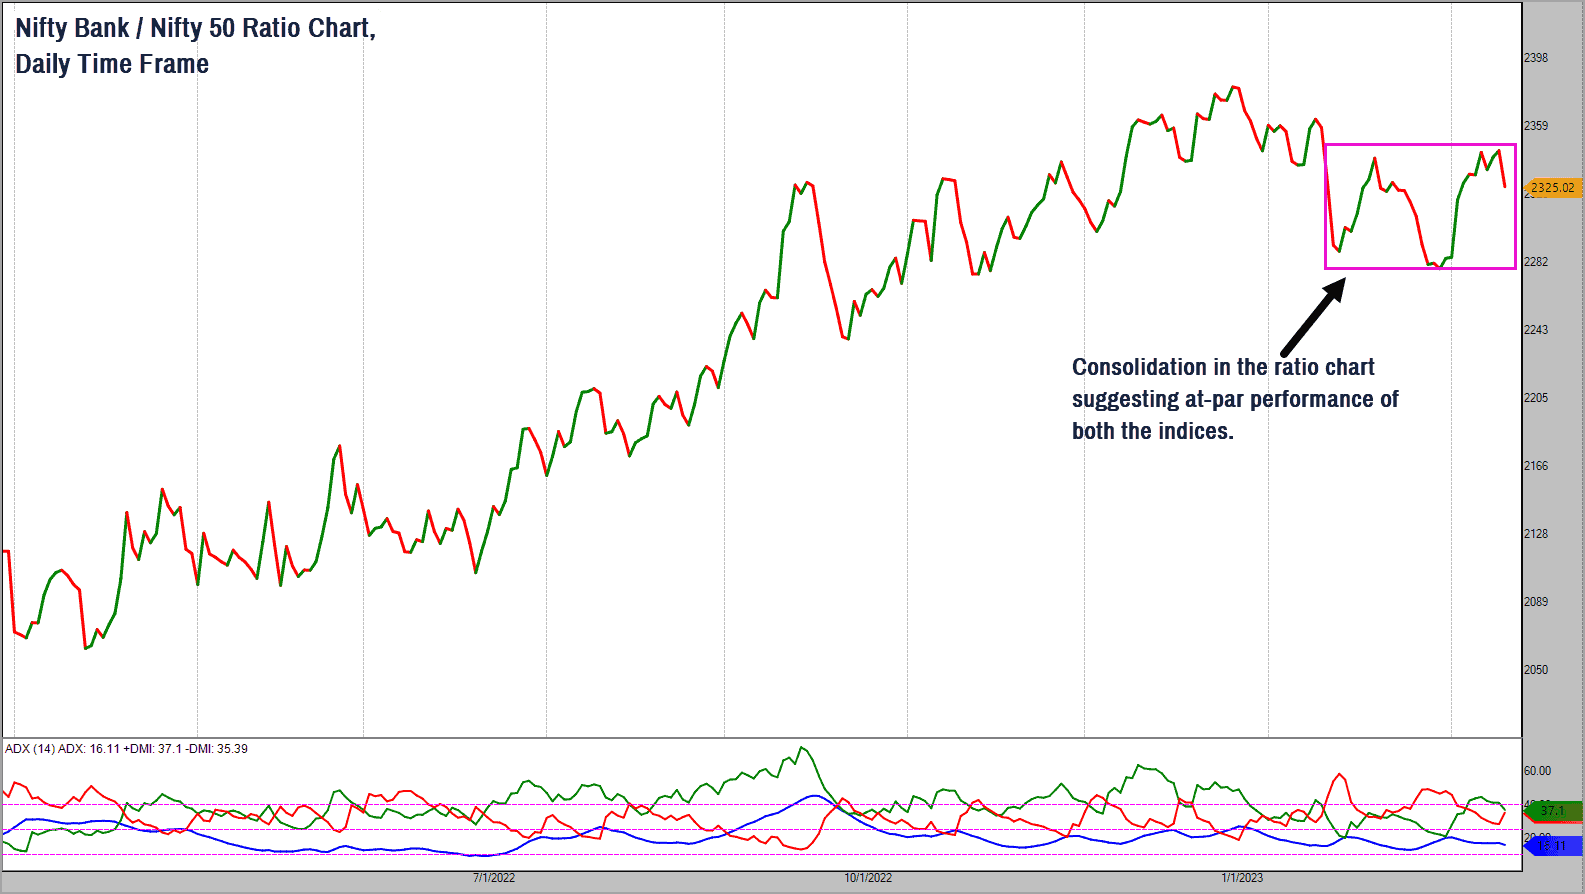
The trend in the ratio chart is bearish and, more recently, the chart has been confined to a range suggesting that the performance of both these indices have been at par. Keep an eye on this ratio chart for further clues about the likely direction in the Nifty 50 index.
A drop below the lower end of the range would suggest underperformance of Nifty Bank and as a consequence, the Nifty 50 index could come under pressure. To support the case for a rally in the Nifty 50 index, the ratio chart has to gather some upside momentum and head higher.
Other sectors
Except for the Nifty FMCG & Nifty PSE sectors, the other sector indices are not showing much promise. These two indices are trading very close to their lifetime highs, which is a sign of strength. These two sectors could play a lead role when the Nifty 50 index resumes its uptrend.
For now, I am waiting for the medium-term breadth indicator (currently at 42%) to reach the oversold zone. Once this happens, I would be keen to put some money to work in the Nifty 50 index fund or ETF. Read the previous post for further details.