We have been publishing updates on the Nifty 50 outlook. You can read the most recent update on the Nifty 50 outlook here. In this article, we take another look at the index. In the previous update, we had mentioned that the outlook for Nifty 50 was positive, and the expectation was a rise to the targets at 16,695 & 18,630.
The price action since the previous update has reaffirmed the earlier positive outlook. We maintain the bullish view and expect the Nifty 50 index to soon reach the first target at 16,695. The next target based on the more recent price action works out to 17,156. Let us take a closer look at the updated charts and understand the basis for this positive outlook.
Short-term positivity
As always, we’ll begin our analysis with the long-term chart. Have a look at the Renko chart of Nifty 50 index plotted using a 3% brick size.
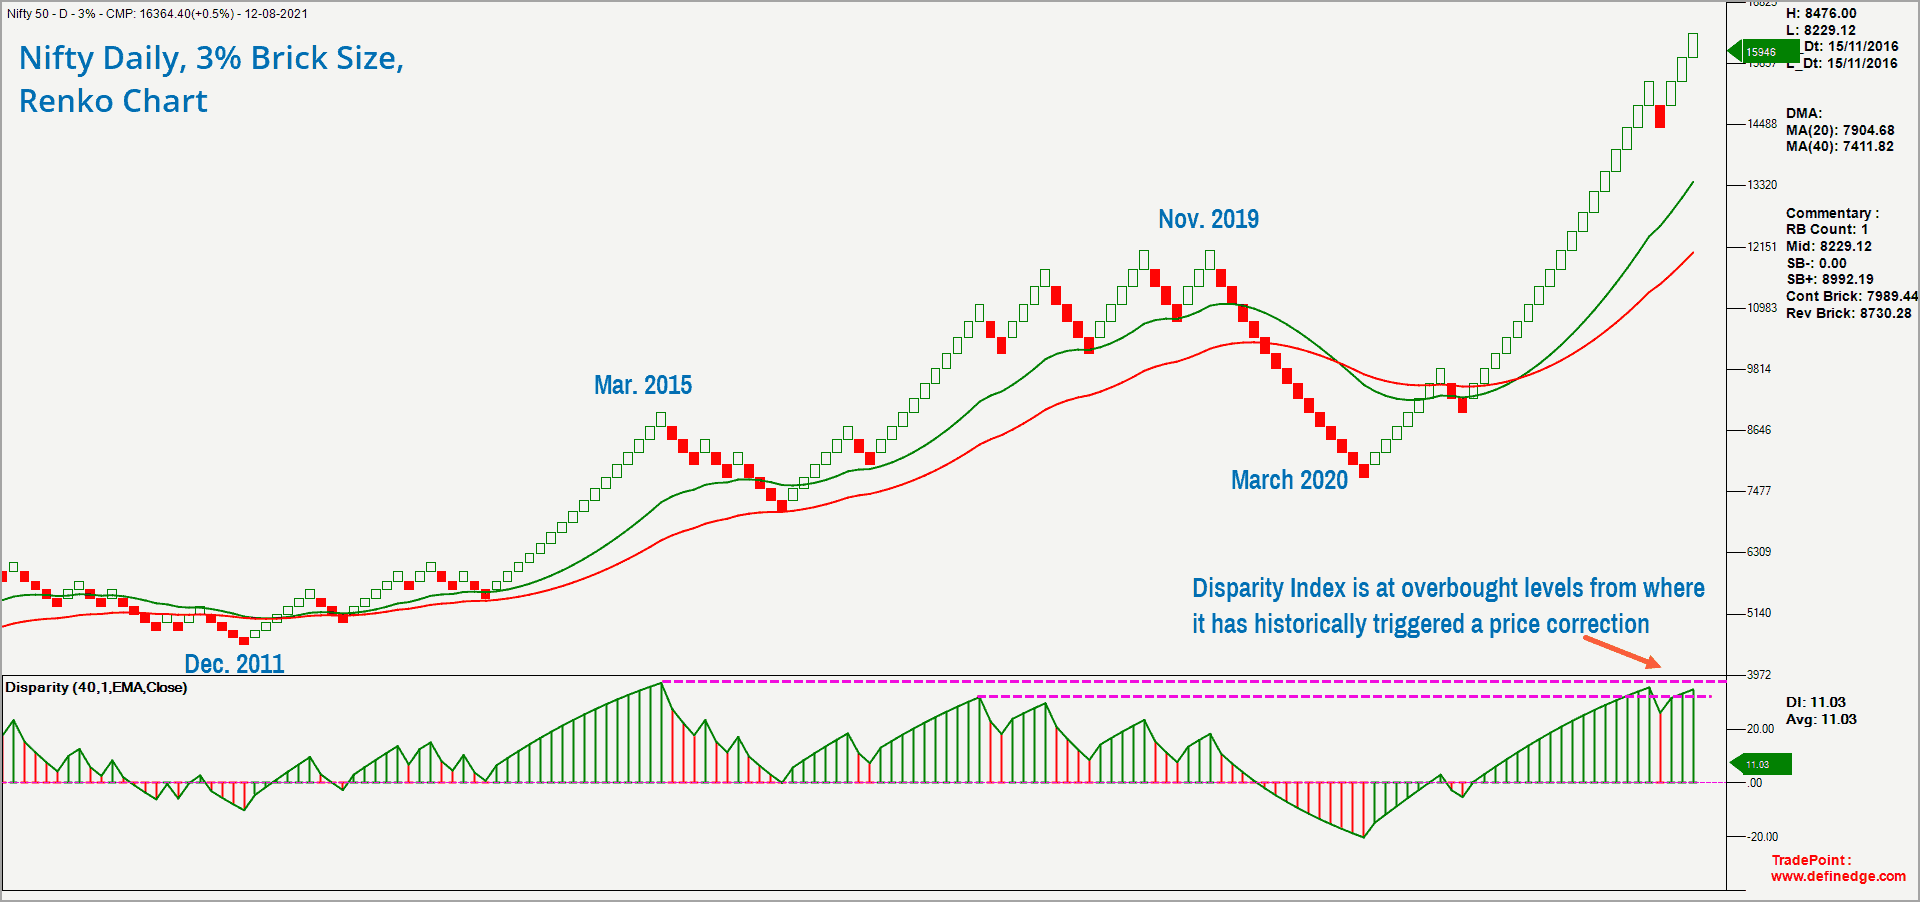
The Disparity Index indicator is plotted in the lower pane in the above chart. This indicator measures the distance between the price and the 40-brick moving average and expresses it in percentage terms.
It is apparent from the above chart that the Disparity Index is heading towards levels from which the price has historically turned lower. In essence, the price is on the verge of getting into overbought territory. This is a cause of concern from a broader perspective.

But let us take a look at the short-term scenario using a 1% brick size Renko Chart. The view based on this chart is relevant for the next 45-60 days.
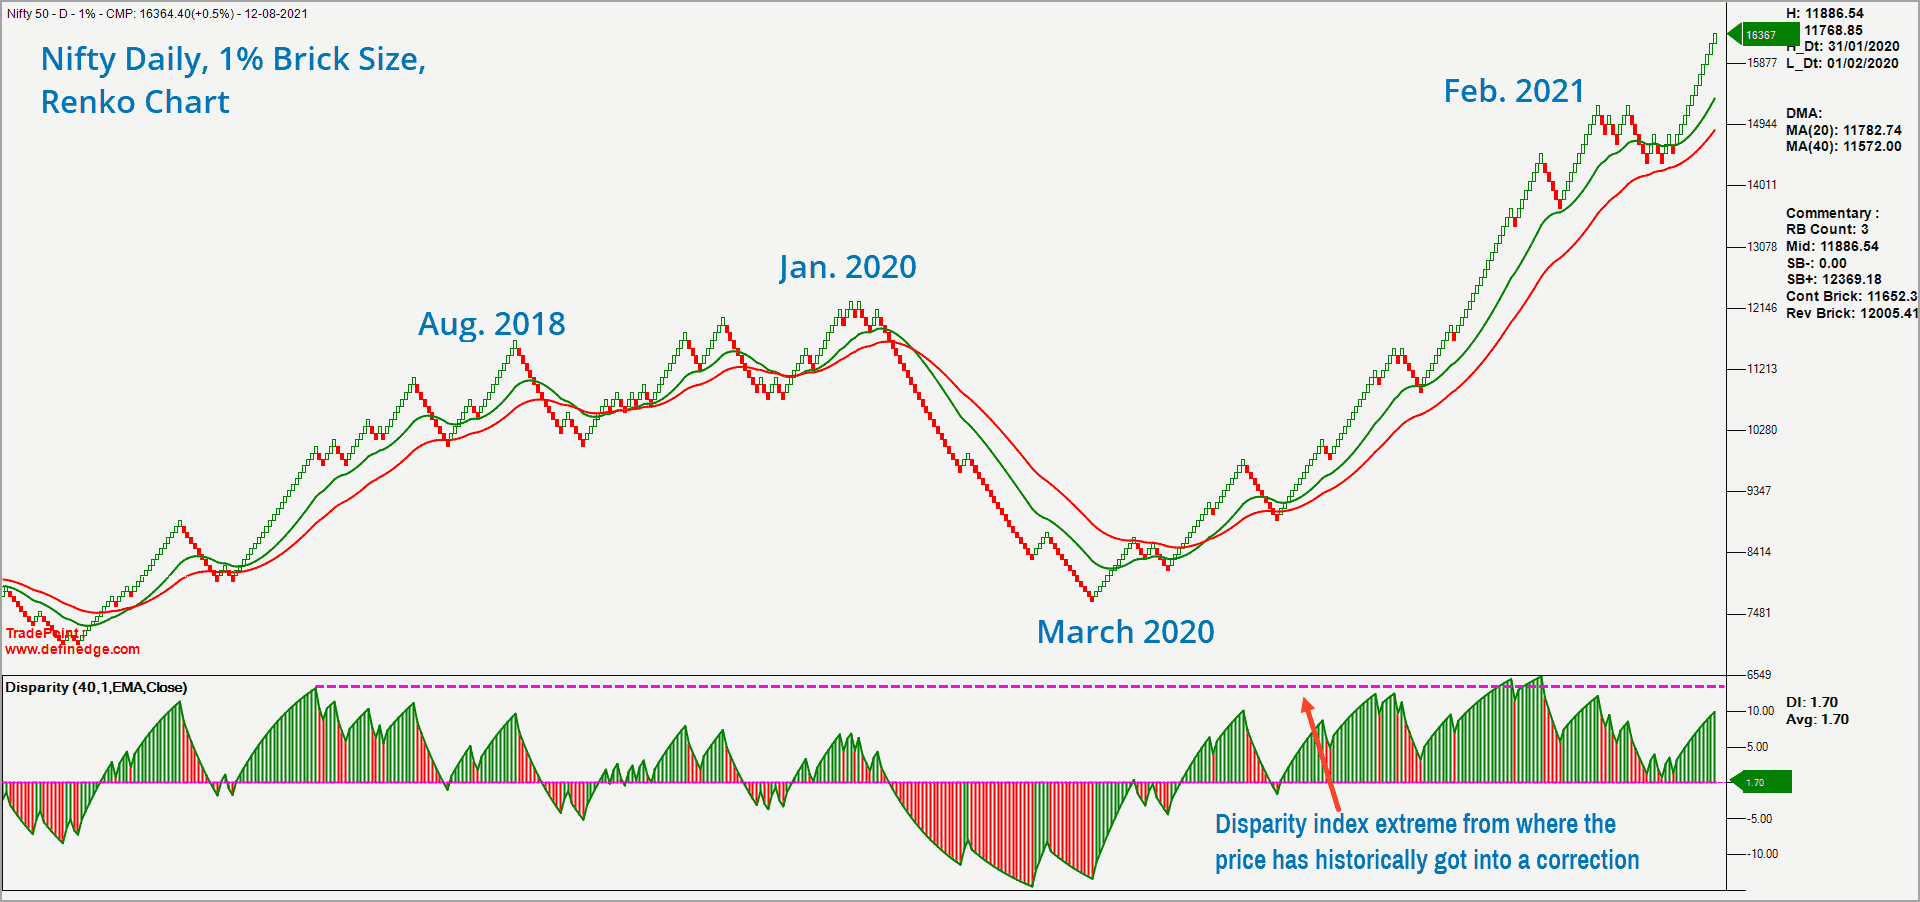
If you notice, the Disparity Index has turned higher after easing to the zero level. Unlike in the 3% brick size chart, the Disparity Index is nowhere near the historic highs from where it has turned lower. So, the short-term chart is not overbought and supports the case for a short-term rally.
Breadth Indicators
In the price chart, the Nifty 50 index is trading at lifetime highs and has completed a breakout from a trading range. This is a distinct sign of bullishness. A look at the breadth indicators will help check if they support the bullishness displayed by the price action.
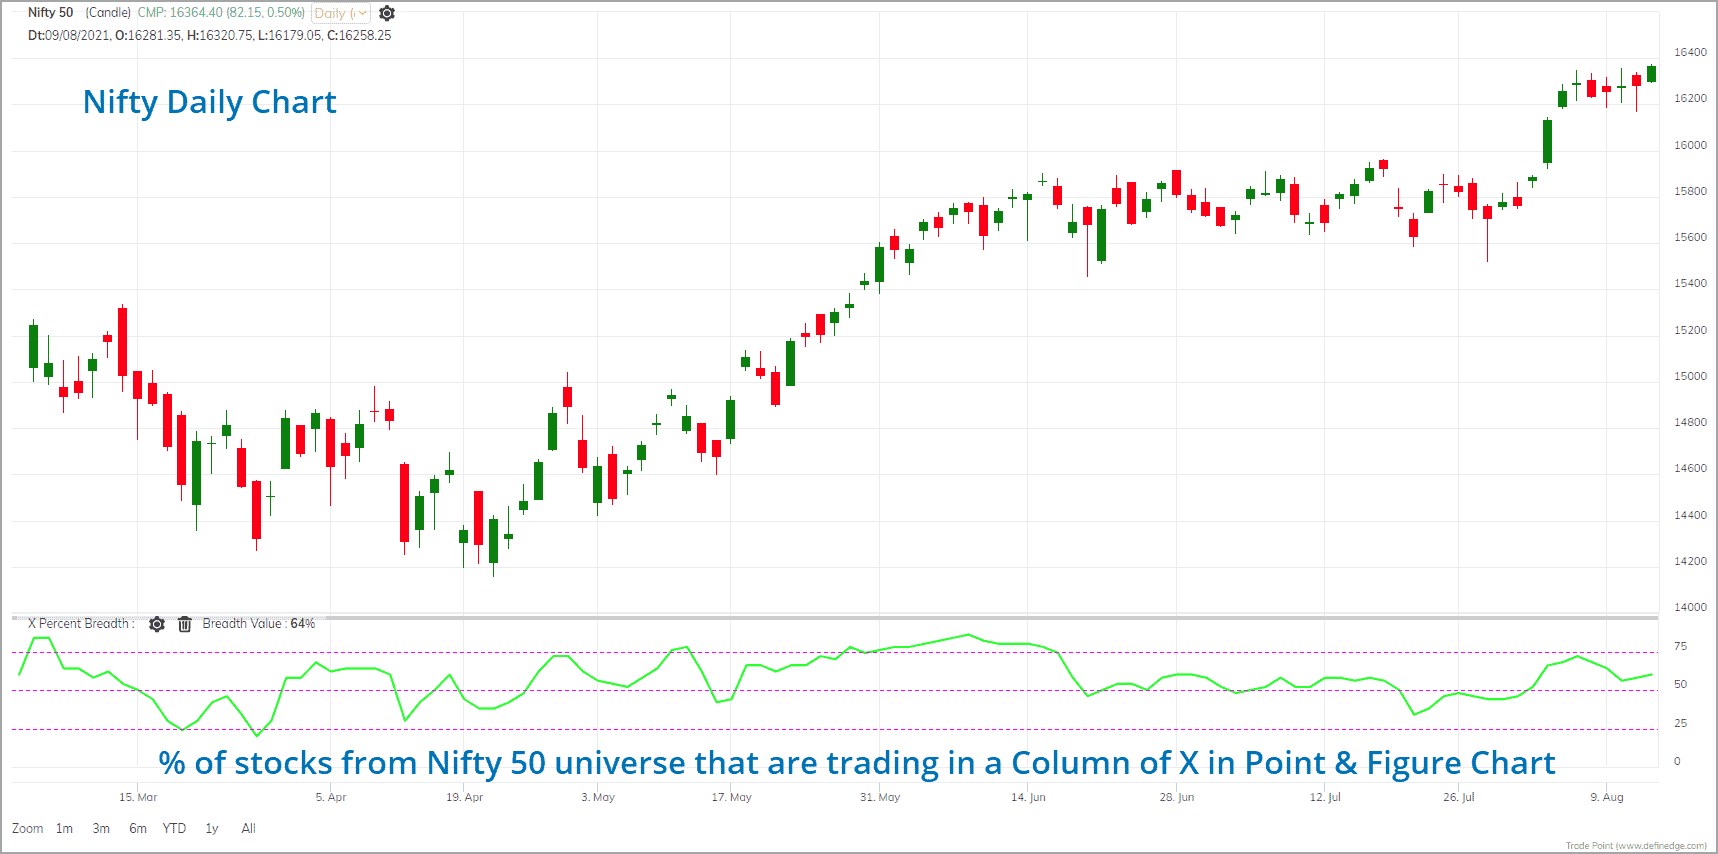
The short-term breadth indicator, called PF-X%, is plotted in the lower pane in the above chart. This breadth indicator captures the percentage of stocks which are in a column of X in the 1% box size Point & Figure chart. If the price is in a column of X in the Point & Figure chart, it basically indicates that the price is in a bullish swing.
While the index was consolidating recently, the breadth indicator cooled off towards the 50% mark. There was an improvement in the breadth on Thursday when the Nifty 50 index closed on a positive note and displayed signs of breaking out of the trading range.
The indicator is still in the neutral zone suggesting that breadth is not overbought yet. This supports the case for a short-term rise in the Nifty 50 index. The steady improvement in the breadth off the July 27 low is also a healthy sign.
The PF-X% indicator plotted using a 3% box size would reflect the medium-term timeframe breadth. This medium-term breadth indicator is currently at 68% which is also neutral. The medium-term breadth indicator too is not in the overbought region, strengthening the case for a short-term rise.
The only cause of concern is the long-term breadth indicator which is overbought at 84% indicating that 42 out of the 50 stocks from the Nifty 50 universe are already in a bullish swing. This breadth indicator is calculated in the 5% box size Point & Figure chart.

Conclusion
So, the long-term price chart and the long-term breadth indicator suggest caution as they are at overbought levels. However, the short-term charts and breadth indicators are accommodative of a short-term move up.
As the long-term metrics are overbought, do not get too adventurous with your fresh exposure to the equity market. There is a case of a cool off in the market when the short-term price action and the breadth indicator reach elevated levels or get into the overbought zone.
Here are the key takeaways:
- The short-term outlook for the Nifty 50 is positive. A rise to the immediate target of 16,695 is possible. The next target based on the vertical count method in the Point & Figure chart works out to 17,156.
- These targets would be valid as long as the price trades above the swing low at 15,400.
Do not tamper with your ongoing SIPs, based on the outlook expressed in this post.
But if you are someone actively trading or investing in the markets, then scale down your position size as the bigger time frame price and breadth indicators are overbought. As always, have a clearly defined exit plan for your investments, unless they are meant to be passed on to your next generation.
I deal with price action and technical analysis. Hence, I can share simple exit plans based on these studies. A simple exit plan could be close below say the 200-day moving average. If the price of the stock you own closes below the 200-day moving average, then consider exiting at least some portion of your investment. How much quantity to exit is something that is a very individual specific concept. If you want to give the price a little bit more wiggle room, then consider an exit if the 50-day moving average line falls below the 200-day moving average line in the stock that you own.
Enjoy the party until it lasts. But ensure that you are not stranded in the party hall when the party is over.


6 thoughts on “Technical outlook – An update on the Nifty 50”
On which charting platform are you getting such wonderfully plotted renko charts? Pls share. thanks,
Hello:
The charts are plotted using TradePoint software from http://www.definedge.com. They have a web version as well as a windows only desktop exe version.
Regards
B.Krishnakumar
Thanks for this report. Should I follow any specific exit plan for small cap, mid cap and large cap based mutual funds? Will exit and re-entry work in this scenario?
Hello:
Mutual funds is a different ball game. Please consult your financial advisor regarding this. It also depends on your investment horizon and the investment objective. What I have mentioned in the post is more relevant to someone who has direct equity exposure in the market, especially in the mid and small cap space.
Regards
B.Krishnakumar
The Krishnakumar. The 18k plus target that was there in your prior post seems to be missing here. Does this mean, that is shelved for now? Thx again
Hello:
The targets mentioned earlier and in this latest posts are valid. They will be invalidated or shelved only if the Nifty 50 index closes below 15,400.
B.Krishnakumar
Comments are closed.