Even as the Sensex and the Nifty 50 scale new highs, how have individual sectors performed? In this post, we’ll take a look at the sectoral indices in order to identify the outperforming and underperforming sectors. We shall also try to unearth the ones that are setting up well and could end up being the next outperforming sector.
First up, let us take the outperforming sectors.
Outperforming Sectors
The top outperforming sectors are the Nifty IT, Nifty Metals and Nifty Realty sector indices. Let us take a technical look at these sectors along with their relative strength charts.
#1 Nifty IT Index:
Here is the Point & Figure chart of the Nifty IT index plotted using 3% box size, capturing the long-term trend of the index.
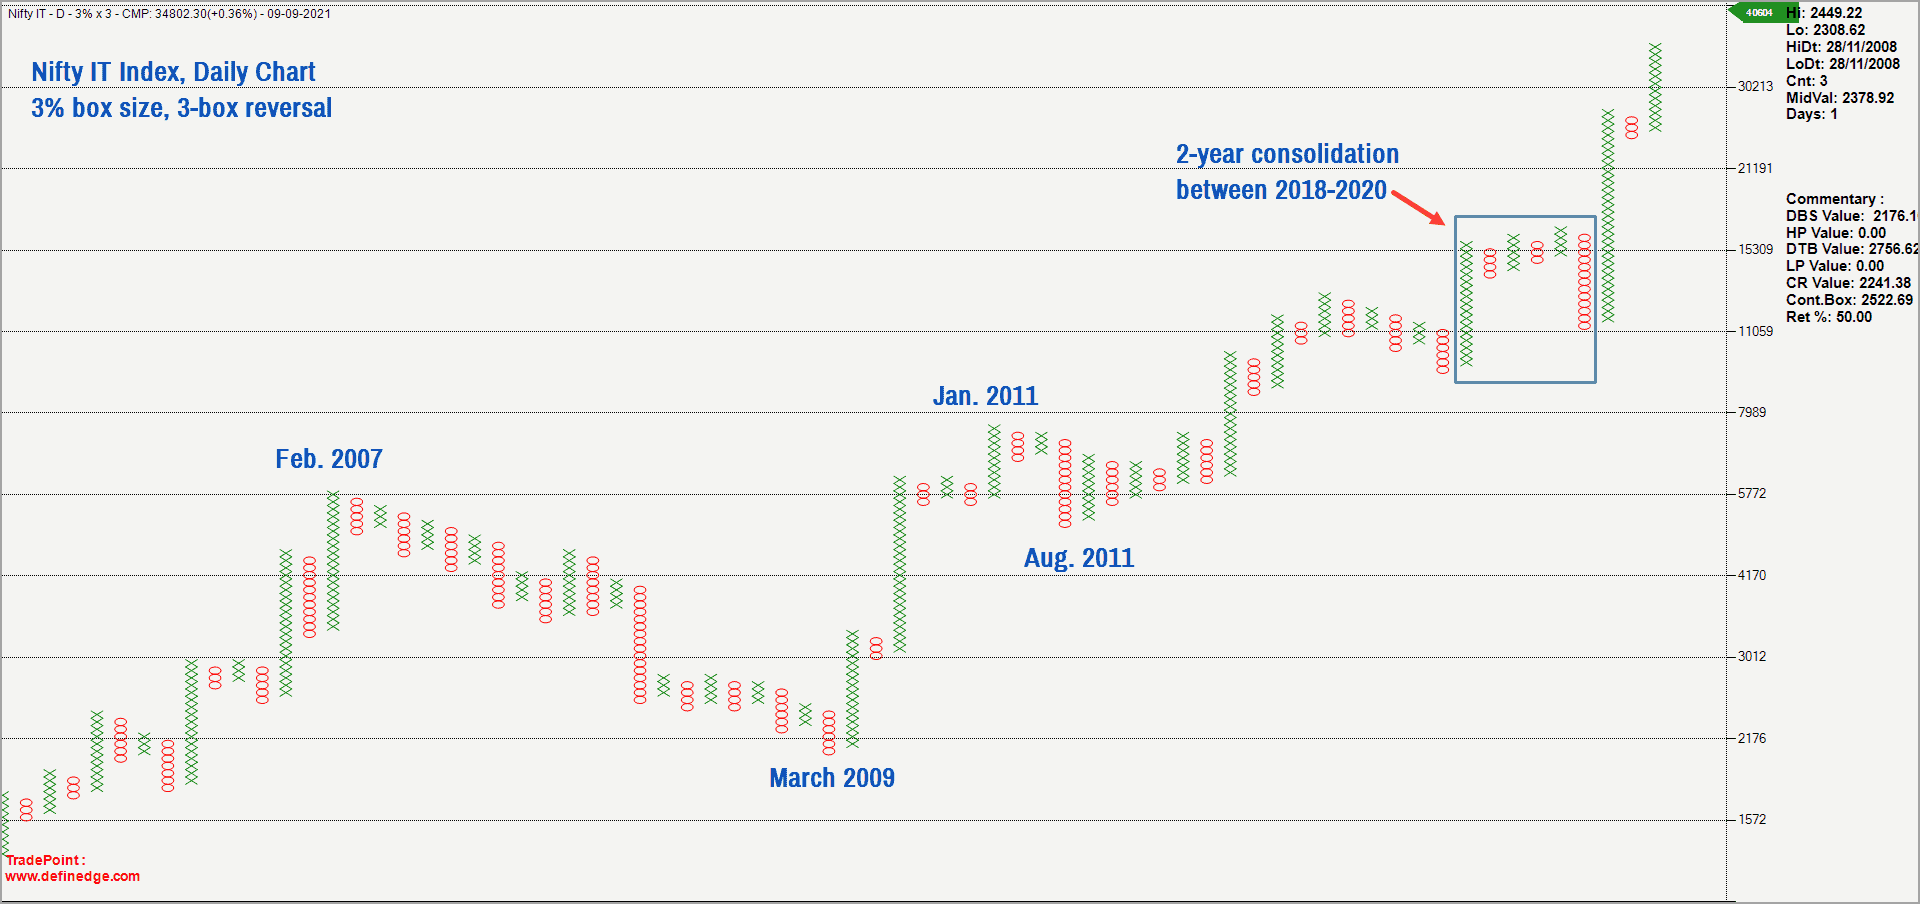
As highlighted in the chart above, the IT index completed a 2-year consolidation breakout in September 2020. The index has since moved up steadily and has been outperforming the Nifty 50 index too. Have a look at the relative strength chart of the Nifty IT index versus the Nifty 50 index plotted using the 1% box size.
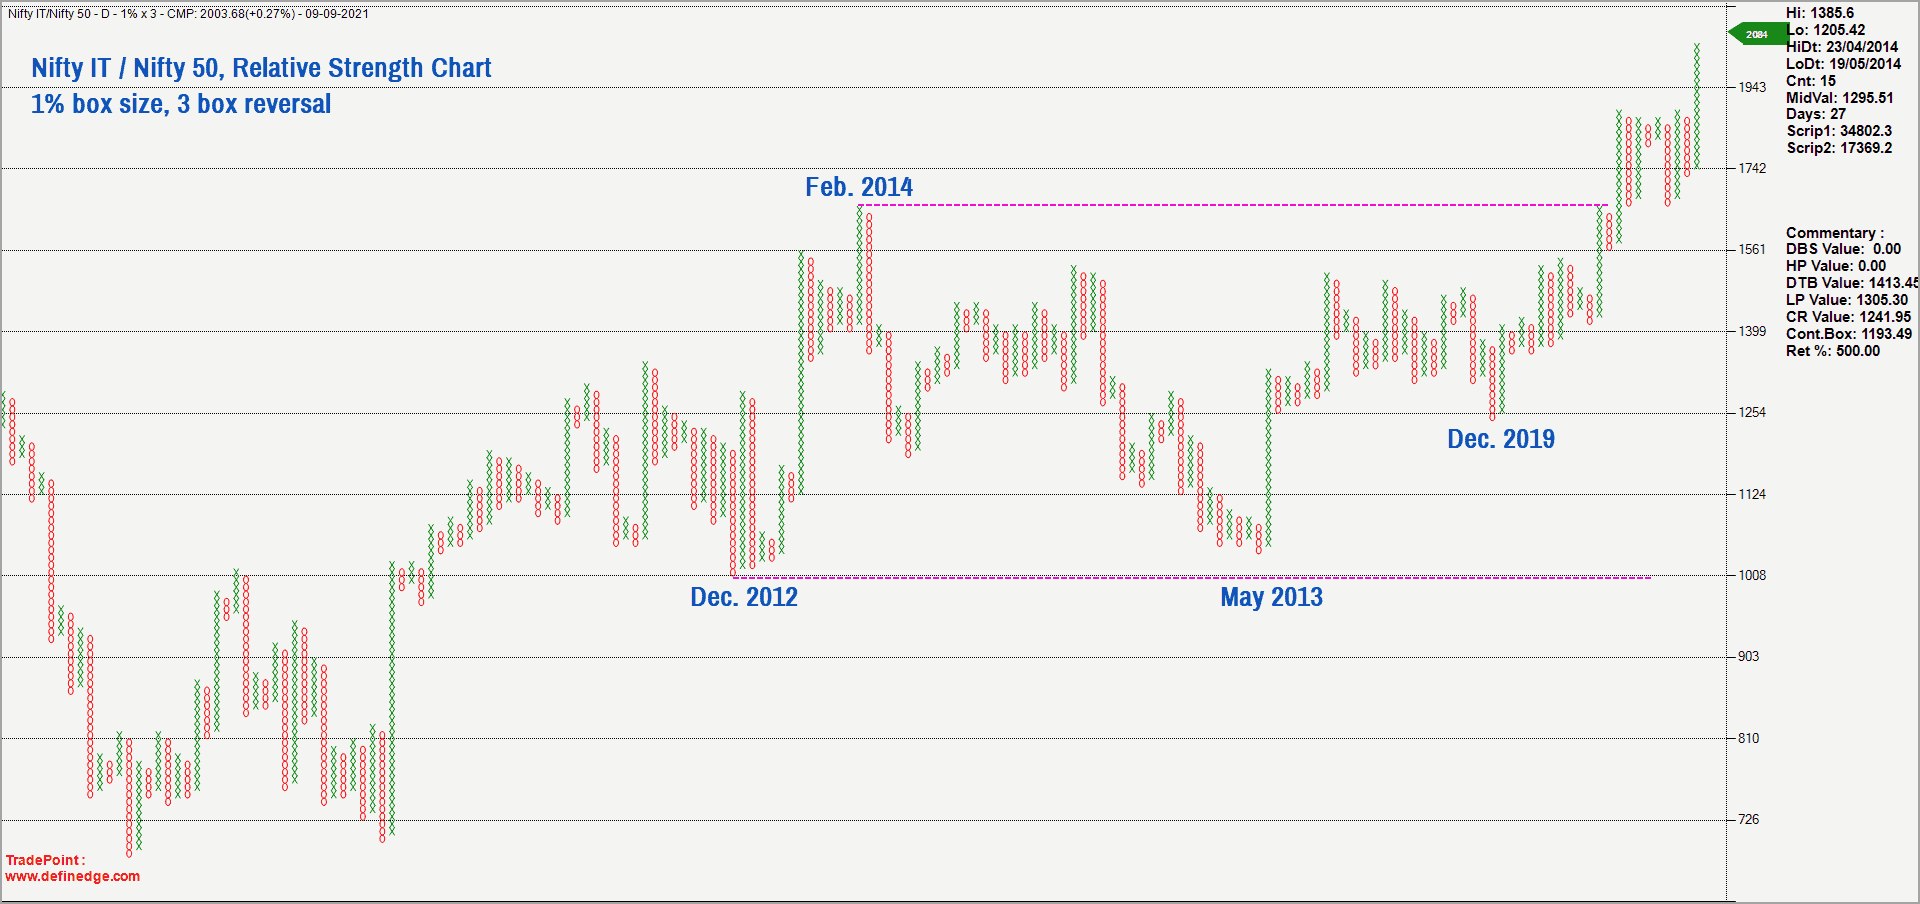
This relative strength chart is very interesting. First, there was a major breakout in the above chart in September 2020. Second, this coincided with the breakout in the price chart as well. The interpretation here is that both the price and relative strength chart turned bullish in September. After the breakout, the price and the relative strength chart got into a consolidation phase that ended in August 2021.
There was a breakout from the consolidation in the price as well as the relative strength chart in August 2021 – a major positive sign indicating bullishness in price action and relative performance. The immediate upside target for the Nifty IT index, based off the Point & Figure chart, works out to the 39,000-40,000 range. Similarly, the target based on the relative strength chart of the Nifty IT index versus the Nifty 50 works out to 2,322. Just for reference, the relative strength chart is currently at 2,004.
From a short-term perspective, the Nifty IT index is cooling off from an overbought zone. As a result, there is relative underperformance which is likely to persist as the overbought condition winds down. But this cool-off could offer potential opportunity to participate in this sector as the medium to long term uptrend in the price and relative strength charts are still in place.
The outlook for the Nifty IT index would be bullish as long as the price trades above 30,000. Any pull back to the 32,250-33,000 range would be an interesting opportunity to increase exposure in IT stocks.
#2 Nifty Metals
This sector has been the top performer since October 2020 with individual stocks appreciating by over 100%. Have a look at the 3% box size Point & Figure chart of the Nifty metal index.
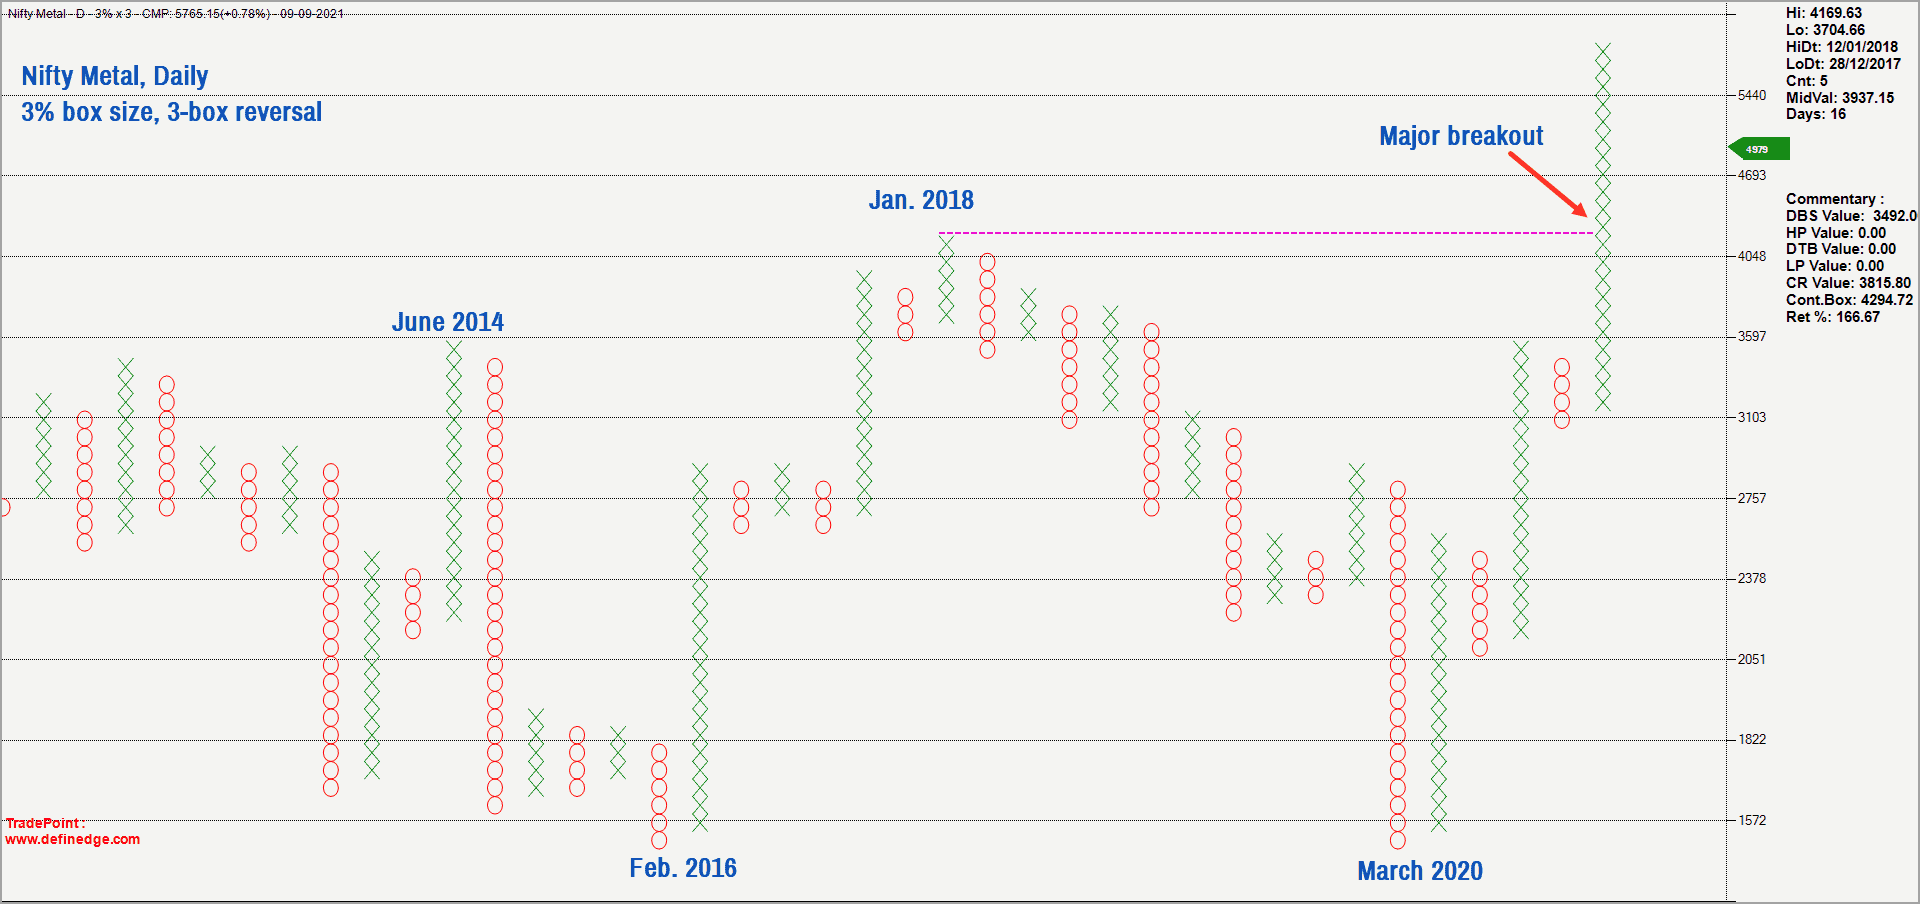
It is apparent from the above chart that the metal index was consolidating in a broad range for several years. The breakout from this range happened in March 2021. This move is a major sign of strength and indicates that the bullish trend in the metals sector could sustain for a while. The short-term target for the Nifty Metal index is 6,945-7,000. This target would be valid as long as the price trades above the 5,000 level.
Let us take a quick look at the relative strength chart of the Nifty Metal index versus the Nifty 50 as well. The strong uptrend in the relative strength chart since October 2020 indicates outperformance of the Metal index.
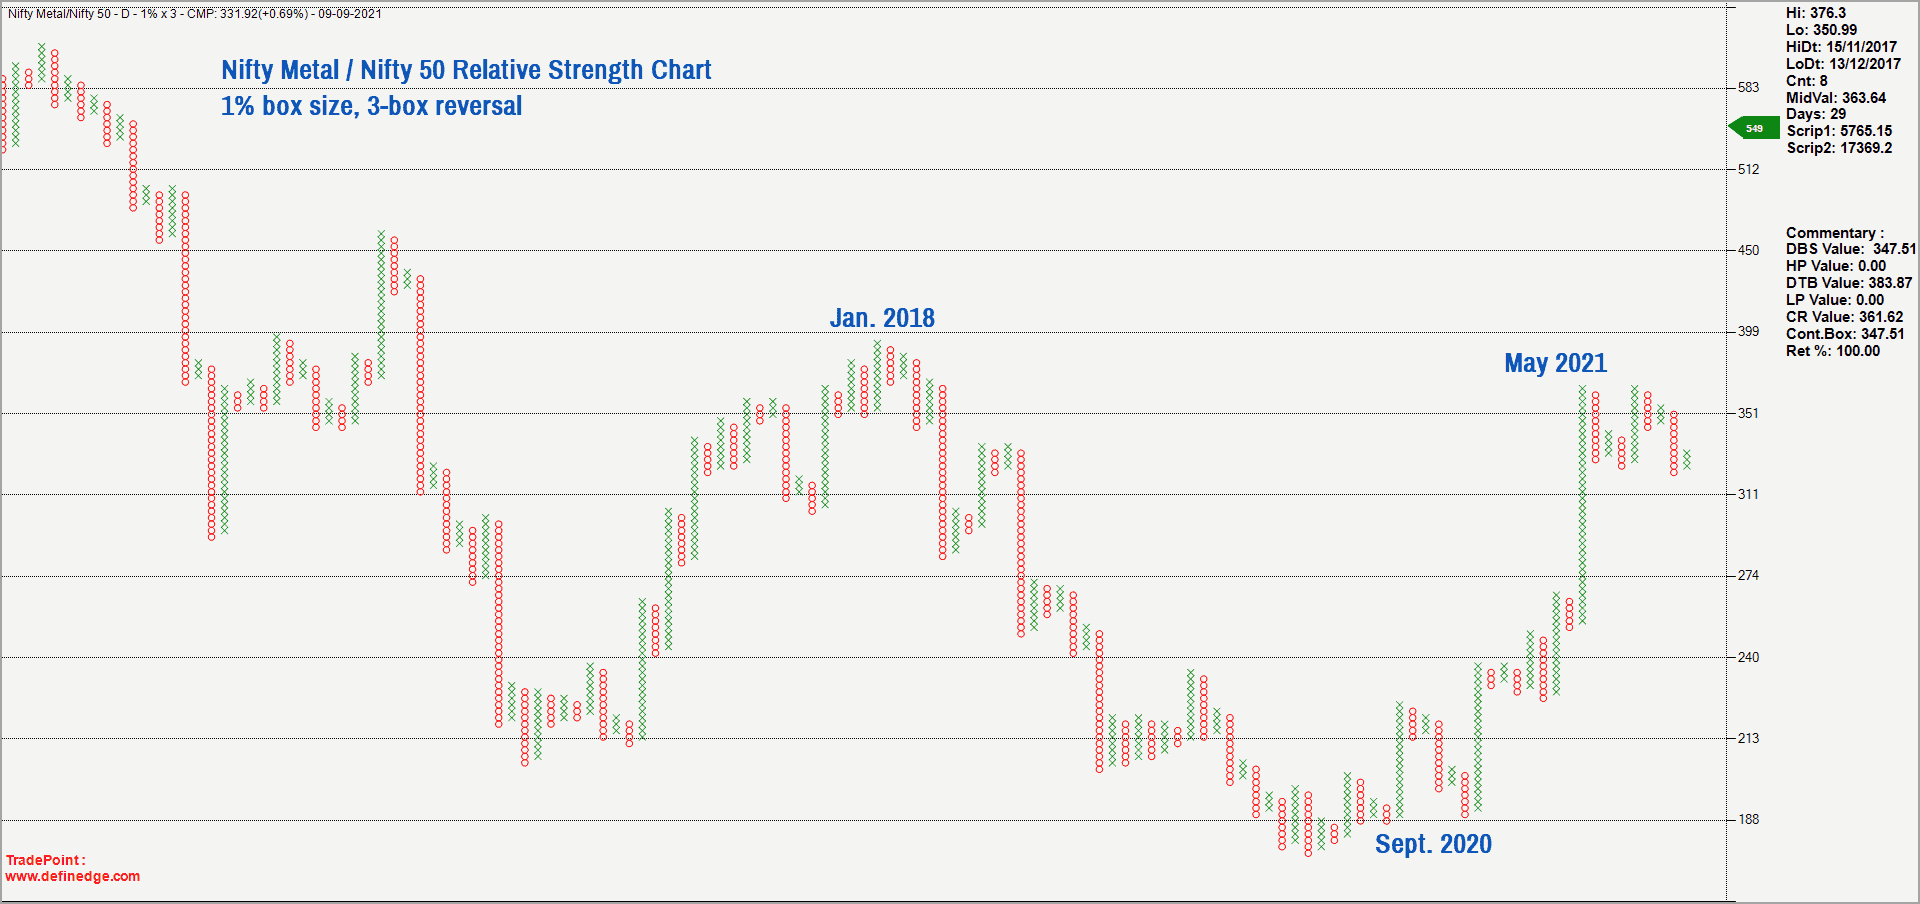
More recently, however, the relative strength chart has moved into consolidation indicating on-par performance of the metal index and the Nifty 50. The sharp rally in the Nifty Metal index had pushed the price to the overbought zone, triggering a short-term mean reversion. As a result, the relative performance versus Nifty 50 index flattened out.
But the price action in the metal index and the relative strength chart indicate a strong case for resumption of the uptrend. Only a close below the 5,000 level in the Nifty Metal index would be a cause of concern. A move past 5,900 would indicate resumption of the uptrend in the Nifty Metal index.
#3 Nifty Realty Index
This is another sector that looks promising in the price chart as well as the relative strength chart. Have a look at the Nifty Realty Index Point & Figure chart plotted in 3% box size.
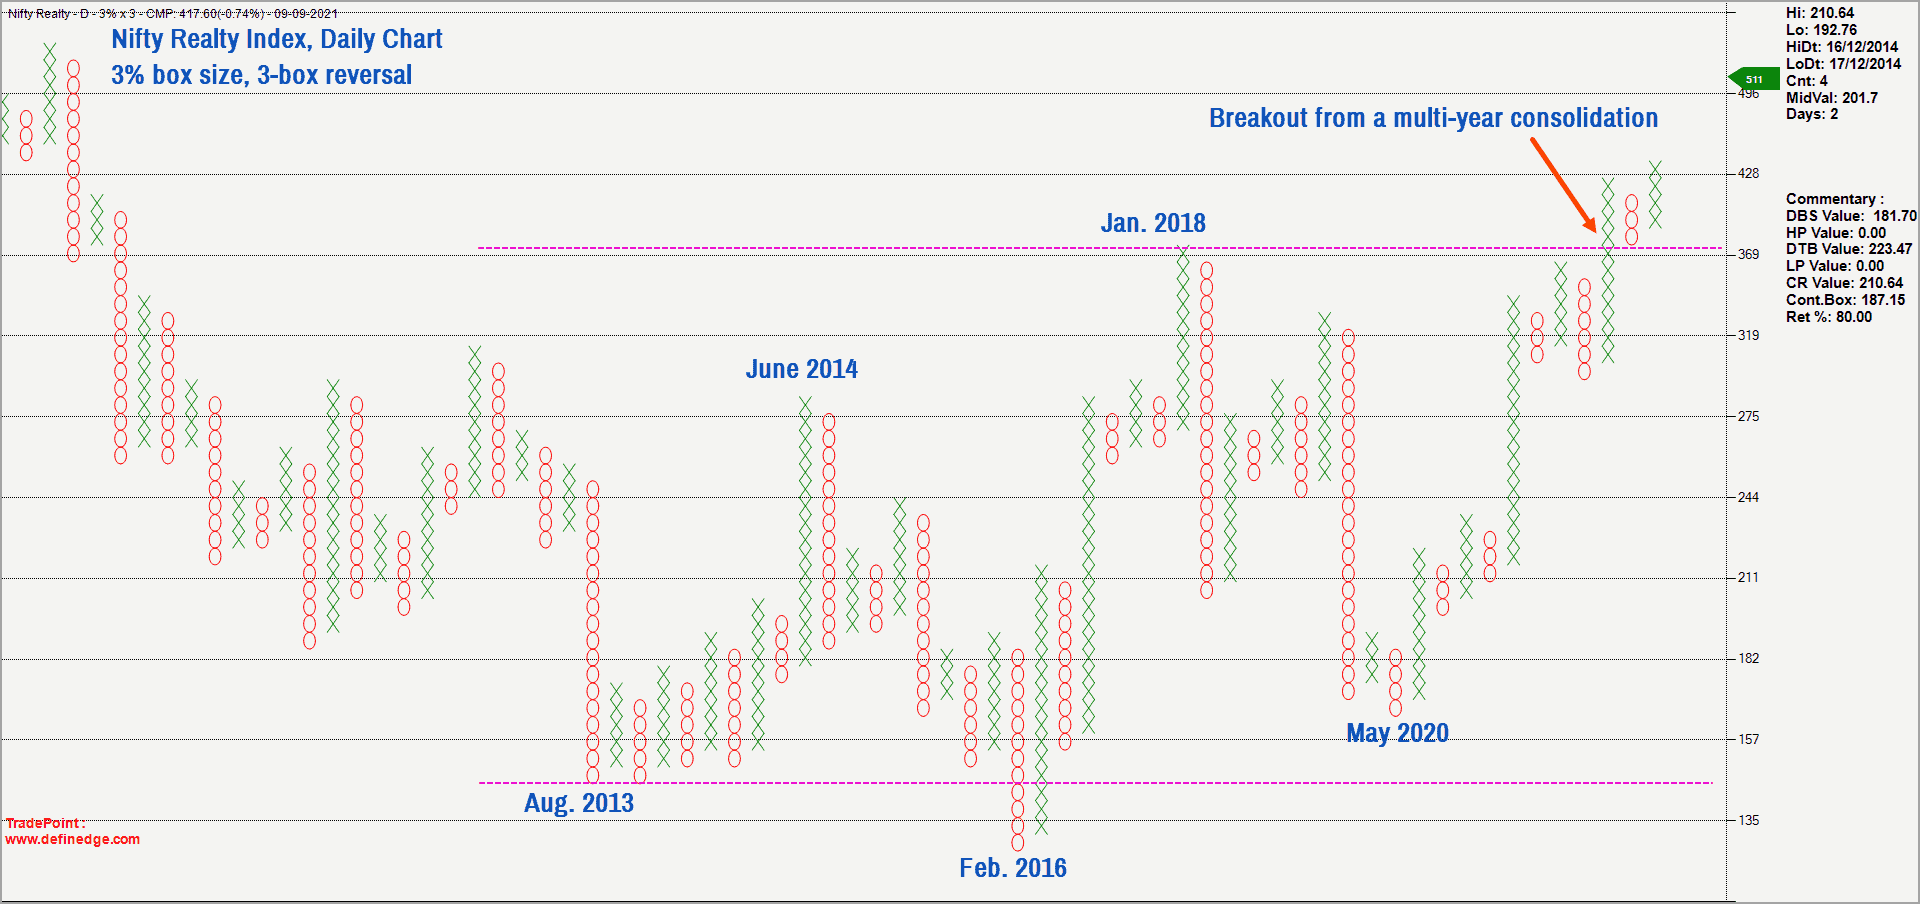
It is apparent from the above chart that there was a major breakout that happened in the Nifty Realty Index earlier this year, which is a significant positive sign. The short-term target for the Nifty Realty Index is 462 & 536. The positive outlook for Nifty Realty Index would be intact until the price drops below 340.
A look at the relative strength chart of Nifty Realty Index versus Nifty 50 suggests that the realty index has been outperforming Nifty 50 since October 2020. While there have been temporary bouts of underperformance, the broad trend has been bullish in the relative strength chart, suggesting outperformance.
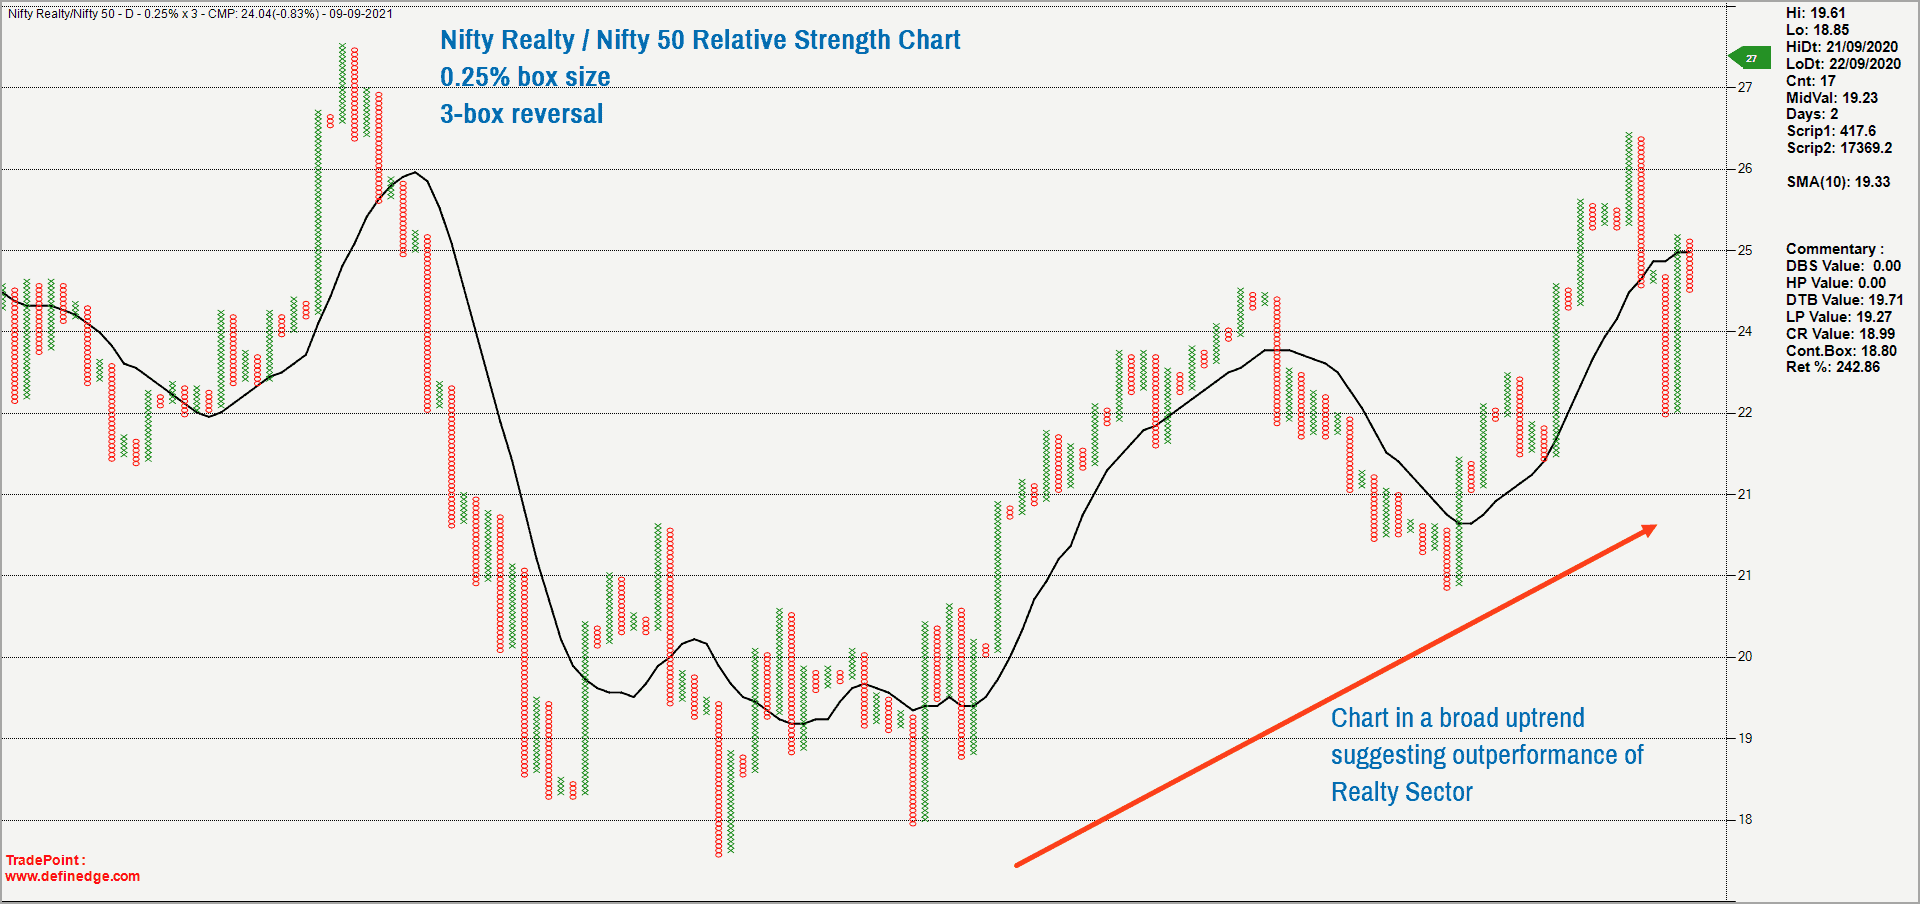
More recently, the Nifty Realty Index has displayed signs of resuming its uptrend in the price chart and the relative strength chart. This sector looks promising, and investors may focus on high quality names from the sector.
Promising Sectors
While the IT, Metals and Realty sector are top outperformers and the ones to focus on, the likes of Nifty Commodities, Nifty Consumption and Nifty Infrastructure look promising. For now, these three sectors seem to have the potential to become significant outperformers against the Nifty 50. Have these sectors in your watchlist and look for investment opportunities if there are signs of relative outperformance.
Dark Horse
The Nifty Bank index is the dark horse. This index has underperformed the Nifty 50 since February 2021. Moreover, the Nifty Bank index is struggling to make upside progress and there is clear lack of momentum in the price action. Hence, there are still no signs of relative outperformance versus the Nifty 50.
Even so, the sector could easily flip to the outperformer category, making it a good idea to keep tabs on this sector. A breakout past the recent high at 37,400 would be a major sign of strength and this could lend momentum to the price action. Since the index can move swiftly if the momentum picks up, careful watching can help seize the opportunity.
The other sectors – such as Nifty Media, Nifty Pharma, Nifty PSE & Nifty PSU Bank – are currently underperforming the Nifty 50 index. Until there are convincing signs of a pickup in momentum in the price chart and relative strength chart, there is no merit in focusing on these sectors.
It is pertinent to remember that the study of relative performance is relevant for investors when the trend in the underlying (the Nifty 50 in our case) is bullish. If the trend in the underlying index turns bearish, there is little merit in looking for buying opportunities using relative outperformance study.
For now, the Nifty 50 is still bullish and the contents of this post would be relevant as long as the Nifty 50 trades above 15,600.


11 thoughts on “Nifty Sectoral Indices: Outperformers & the promising ones”
Very useful article. I’m unable to find any index funds that track these indices. If there are any, please suggest.
Unable to read doc.even thought I m registered memebr
This article is open for our Growth plan subscribers only. If you hold the Essentials plan, you will not be able to access it. You can upgrade to Growth, if you wish to. – thanks, Bhavana
Nice article and very useful
Hello:
Glad to know that you found the post useful. Appreciate your feedback.
Regards
B.Krishnakumar
Good research. Within the promising sectors, you can filter and identify few stocks for long term. For instance, in a growing economy, I am confident about private sector banks . Decades back, I identified Hdfc bank and bought huge qty below 100 (fv 10). It had given me extra ordinary return. Is it possible to research and identify promising banks say IDFC first or Federal or city union with 10 years down the line .
Hello:
Thanks for your suggestion. But, I would prefer not to get into stock specific recommendations. My time frame and risk profile need not suit the reader. Request you to consult your financial advisor for stock specific inputs.
Regards
B.Krishnakumar
Can u throw some light how to perform these technical research
Hello;
Please do some study / research on relative strength concept. There are multiple ways to perform this study. I prefer using Noiseless charts such as Point & Figure or Renko. You can choose normal line charts too. But, what I am sharing here is a result of several years of study / practice. The concept is simple and anyone can practice it.
Regards
B.Krishnakumar
Thanks, this excellent research. From here we can start to filter down the specific stocks that are outperforming their peers, esp. the Reality sector which has just shown the breakout.
Hello:
Thanks a lot for your feedback. Nice to hear that you found the post useful.
Regards
B.Krishnakumar
Comments are closed.