
The benchmark Nifty 50 index has been drifting lower since February 16, 2021 when it recorded a high of 15,431.8. While there has been some recovery in the past few weeks, the real action has shifted to the broader markets. Lots of stocks from the mid-cap and small-cap sectors have continued to seek higher levels even as the Nifty 50 index has been struggling in a broad range.
The Nifty MidSmallCap 400 index hit an all-time-high of 8,822 on May 12, 20201. Let us assess the technical structure of this index to see if there’s room for a further rally.
General trends
To begin with, here is the Point & Figure chart of Nifty MidSmallCap 400 index with probable targets calculated using the Vertical Count methodology associated with Point & Figure charts.
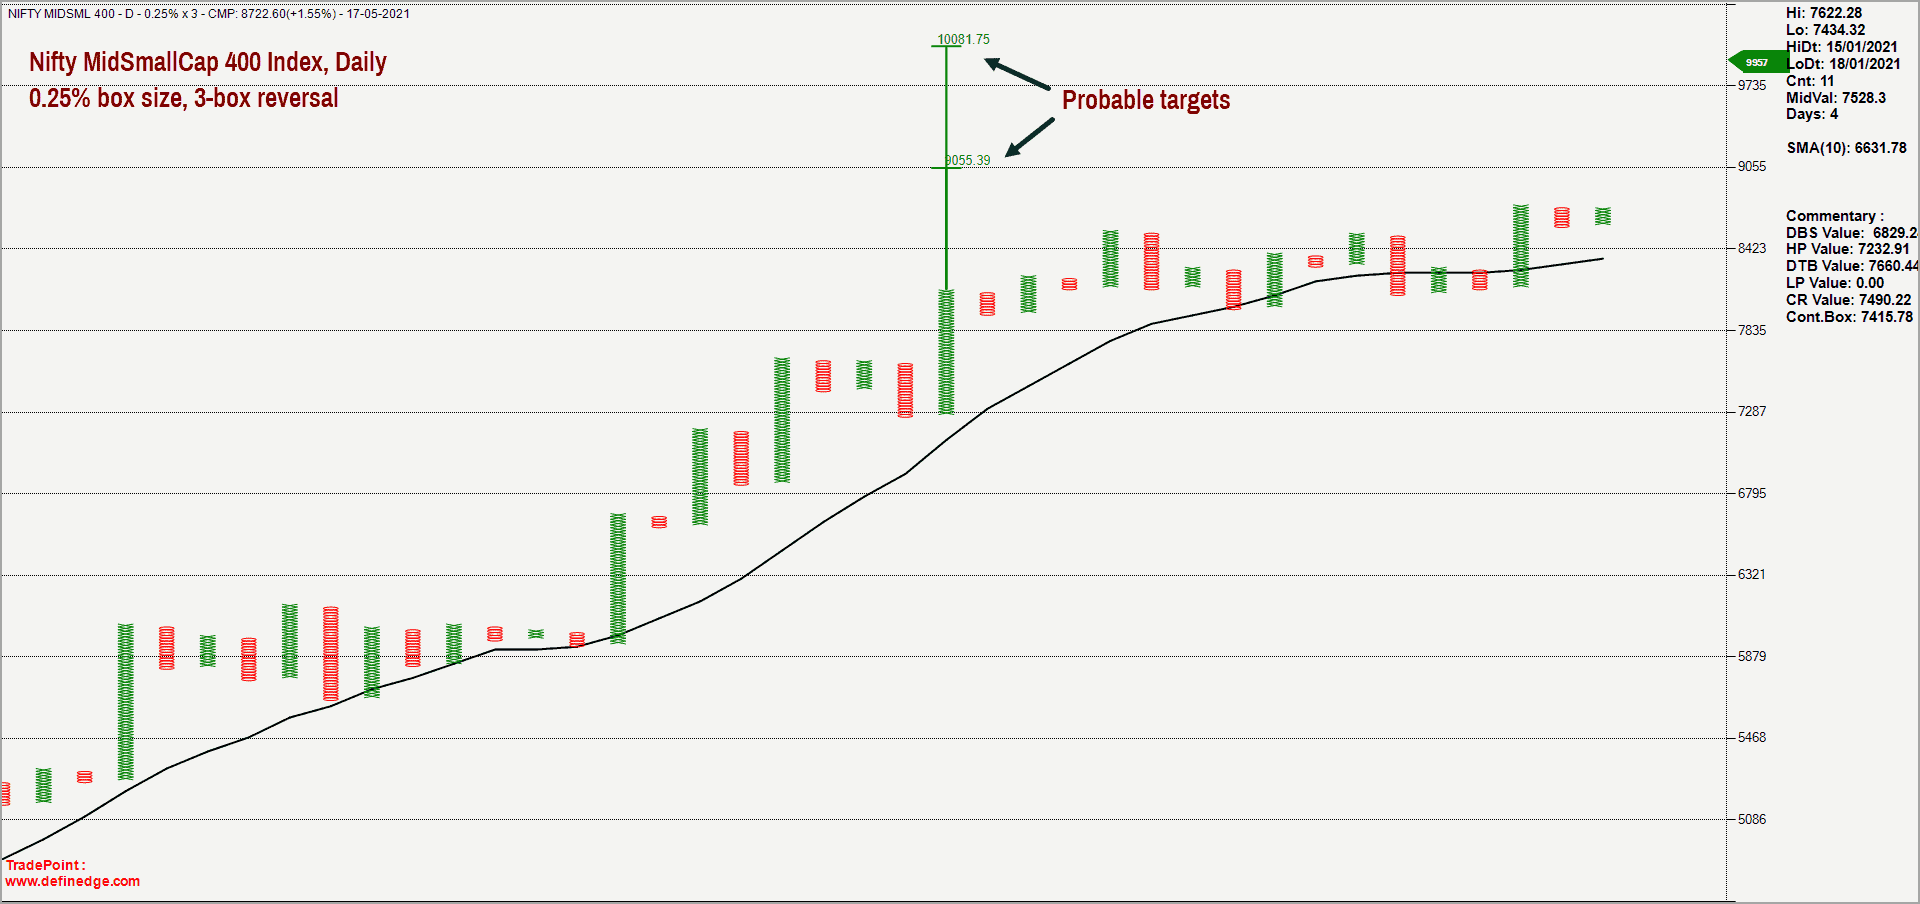
The chart looks undoubtedly bullish with the price trading near all-time highs. As highlighted in the above chart, the target based on vertical count method works out to 9,055 and 10,081. These targets would be invalidated if the Nifty MidSmallCap 400 index closes below 7,250. From a short-term perspective a close below 7,950 would be an early sign of weakness.

Next, consider the relative strength chart of versus Nifty 50 index. Here is the relative strength chart of Nifty MidSmallCap 400 versus Nifty 50, captured in the Renko charting format.
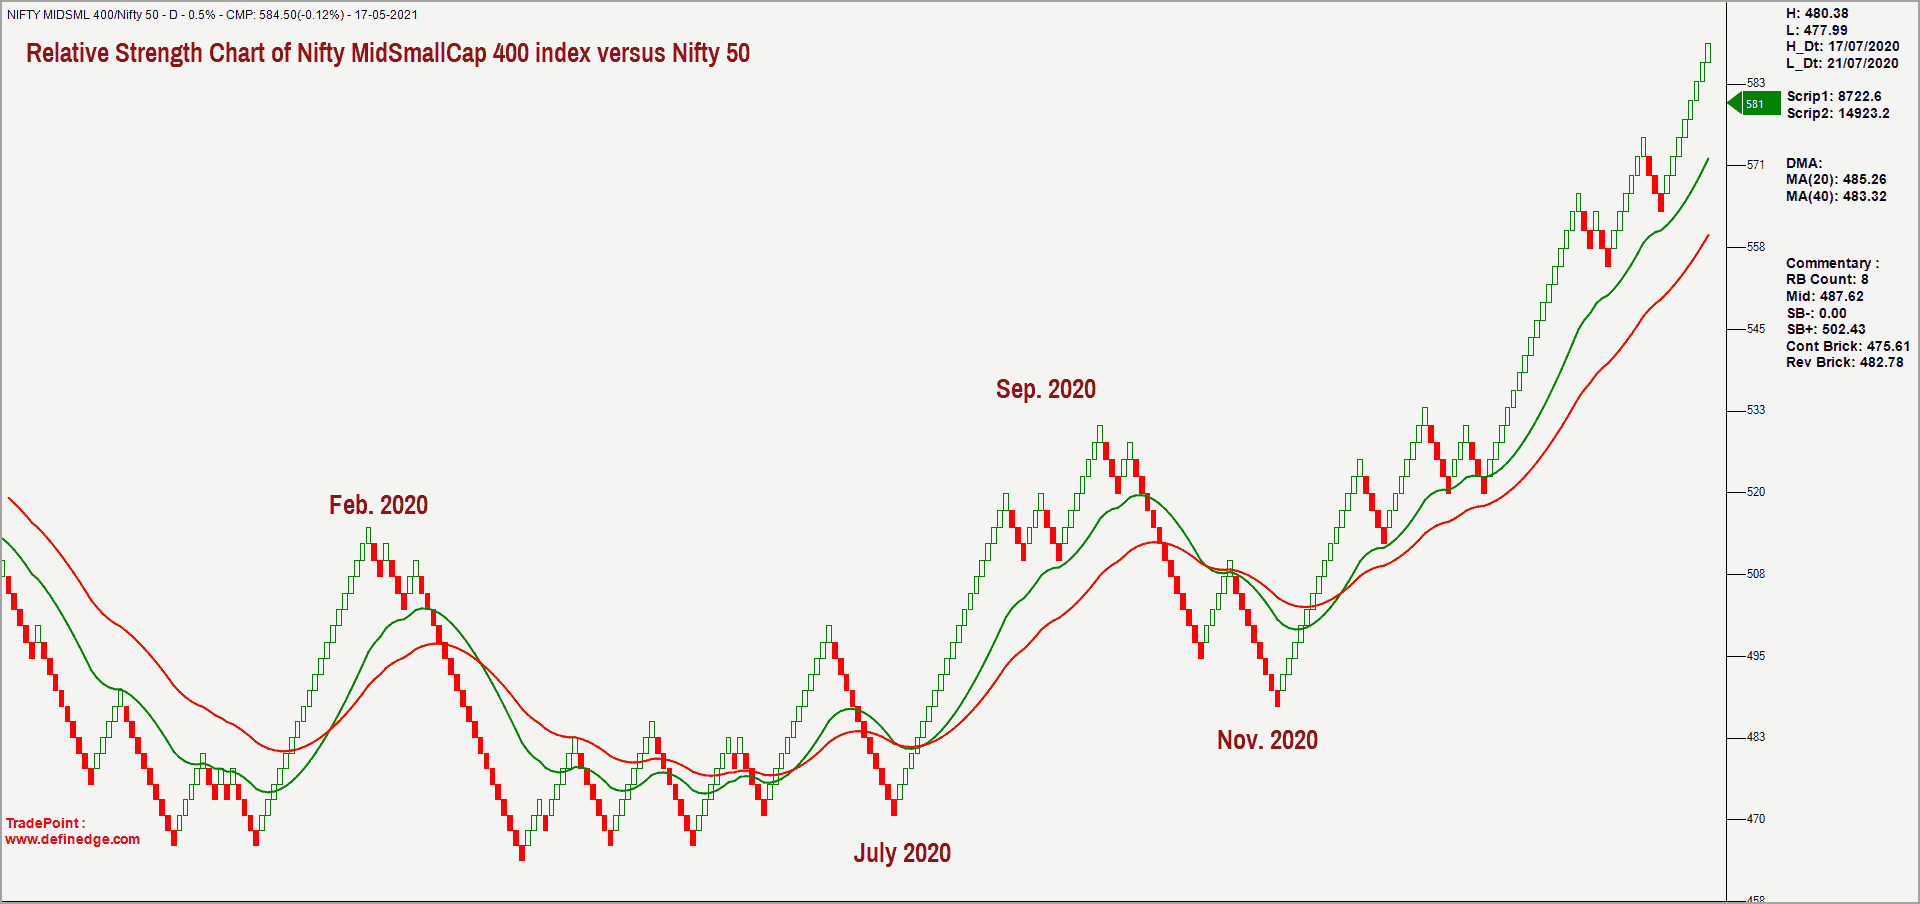
This suggests that the Nifty MidSmallCap 400 index is comfortably outperforming the market benchmark. The above chart is in a strong uptrend with the price trading well above the moving averages. This confirms that the Nifty MidSmallCap 400 is outperforming the Nifty 50 index.

Breadth indicators
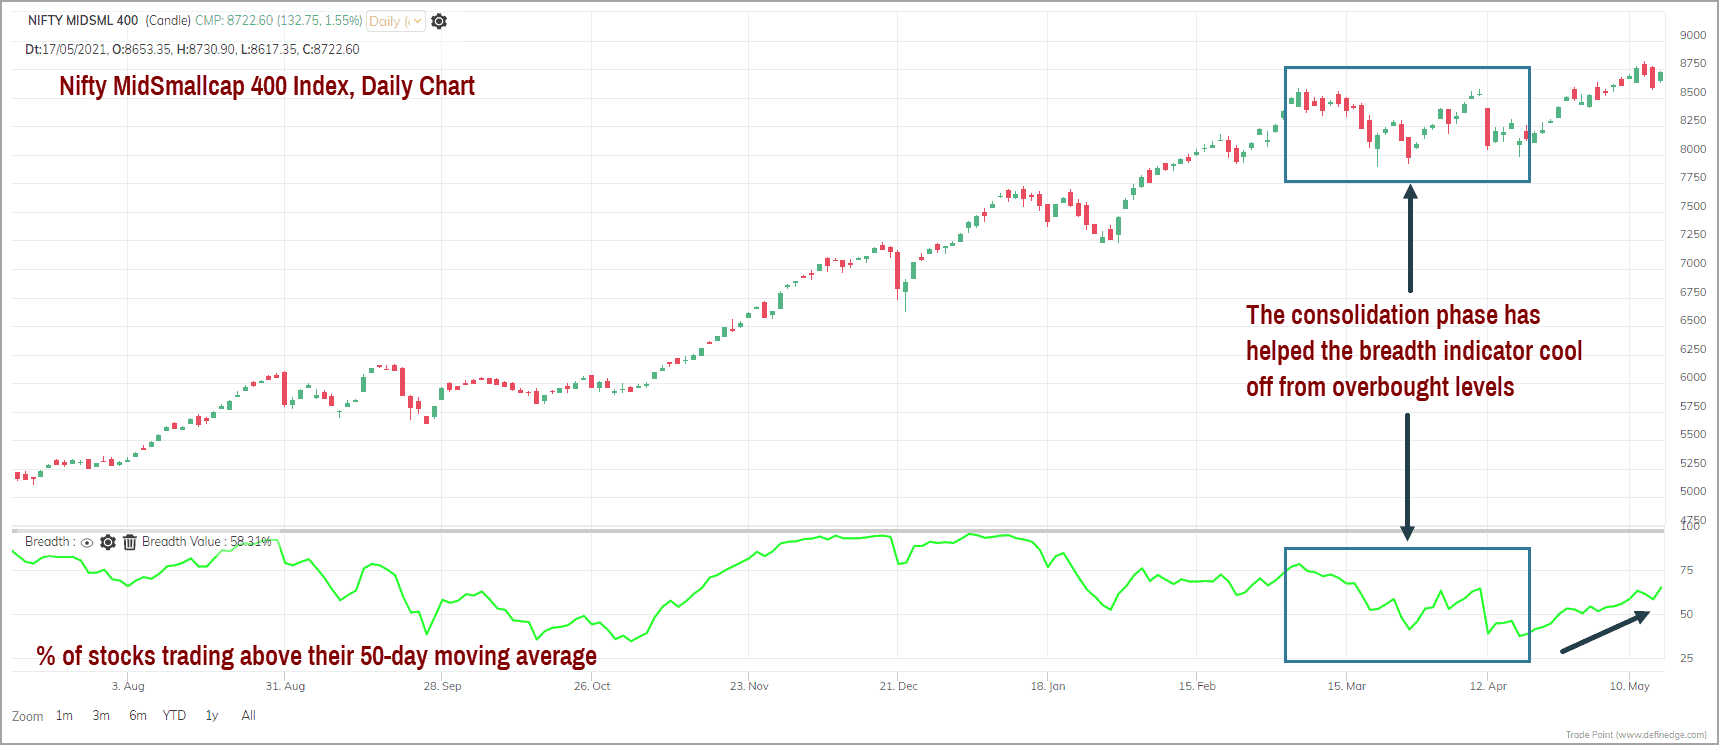
Third, take a quick look at the short-term breadth indicator of Nifty MidSmallCap 400 index. This metric corroborates the possibility of further rally in the Nifty MidSmallCap 400 index. The short-term breadth indicator – measured by percentage of stocks trading above their 50-day moving average – has recovered smartly from the oversold levels recorded last month.
As highlighted in the chart below, the Nifty MidSmallCap 400 got into a consolidation mode which helped the short-term breadth indicator cool off from overbought levels. The subsequent recovery in the price has been backed by a corresponding recovery in the breadth indicator. This a sign of broader participation of stocks from the mid and small-cap universe.
Fourth, consider the long-term breadth indicator, measured by percentage of stocks trading above their 200-day moving average. This indicator is also projecting a positive picture for this index. The current reading for this indicator is 84%, indicating that the majority of the stocks from the index are bullish and also trading above their 200-day moving average.
The only cause of concern is that this long-term breadth indicator reading of 84% can also be interpreted as a cautionary signal. With majority of the stocks already in the bullish zone, the breadth indicator has reached overbought levels. While this is not necessarily a red flag or a sign of potential reversal, it pays to be a little cautious about taking fresh aggressive exposures when the breadth is overbought.

Conclusion
The short-term outlook for the broader markets, represented by the Nifty MidSmallCap 400 index is bullish. There is a strong case for a rally to the immediate target of 9,055. Only a close below the recent swing low of 7,950 would be a cause of concern.
The overheated long term breadth indicator is a slight discomforting factor, but price can still progress higher while this indicator is in the overbought territory. There have been instances where the price has continued to march higher while the long-term breadth indicator was at elevated levels.
So, there is no reason to abandon your SIPs in mid or small cap-oriented funds. If you plan to take fresh exposures in the stocks from this space, be a bit cautious and take limited exposures owing to overbought breadth. As always have a clearly defined exit plan and more importantly stick to that plan.


6 thoughts on “Technical outlook: Is there steam left in mid-and-small caps?”
Thanks for the analysis which has crossed the levels indicated with in 3 weeks of this note. Pks update and tell us what next from a technical perspective.
Hello:
Markets have been in a strong uptrend and has achieved the mid-small cap target. We will soon do an update on Nifty 50 & small cap index. Expect something next week.
Regards
B.Krishnakumar
Sir, Thanks for the analysis. 1) What is the safe level of the Breath Indicator (say something like 50%) to enter apart from other analysis. I understand, we cannot just depend on the indicator for the entry. 2) Is this breath oscillator based on candlestick or point and figure 3) Once we have finalized at the Indices level, can we get breath indicator at stock levels in this indices
Thanks once again for your valuable insights.
Hello:
The breadth indicator is considered overbought if it is above 75% and oversold below 25%. Any reading between these two extremes would be considered as Neutral. Ideal scenario to invest would be when the breadth is in Neutral zone. Of course, the trend in the index concerned should also be borne in mind.
The breadth indicator is calculated based on the candlestick chart. This breadth indicator can be calculated in the web version of the TradePoint software. Am sure there could be other sources too. But I am not aware of any other source to calculate this indicator. If you have stock data and Amibroker softwarre, then this calculation should be possible.
Regards
B.Krishnakumar
Thanks for the analysis. Is there any specific mutual fund covering this Index MidSmallCap 400? It would be useful to get this info
Specifically this index – no, there is no ETF or index fund. – thanks, Bhavana
Comments are closed.