The author is an external contributor. Views are personal and do not reflect the opinion and views of PrimeInvestor.
In the previous update on the Nifty 50, we had mentioned that a move past 19,900 would be a bullish trigger. Well, the Nifty 50 index shot past this level and scaled fresh life-time highs thereafter. In this post, we shall focus on the medium to long-term outlook for the Nifty 50 index, along with a brief short-term outlook too. We shall also take a quick look at a few sectoral indices & the broader market.
Short-term outlook
Here is the daily candlestick chart of the Nifty 50 index.
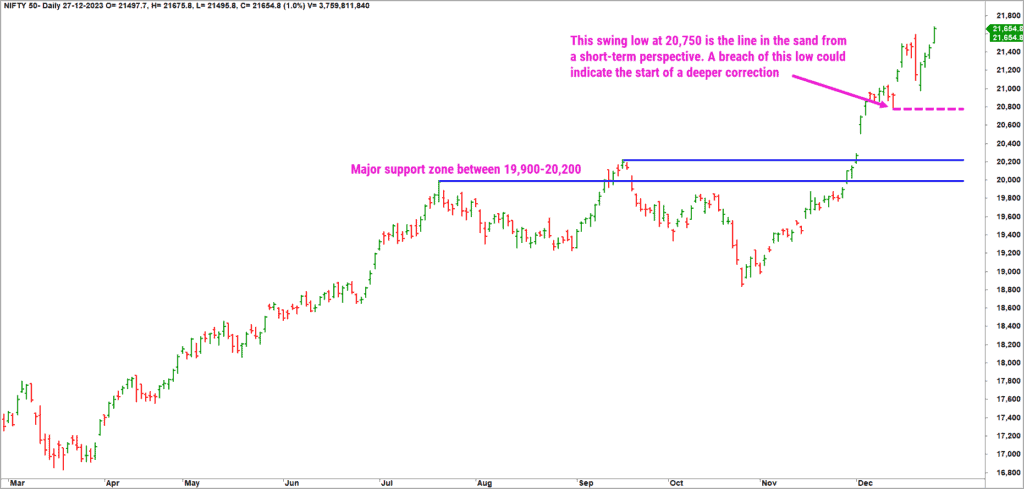
The Nifty 50 index is still progressing in a bullish sequence of higher highs and higher lows. There is nothing remotely bearish yet in the price chart of the index. As highlighted in the chart above, a fall below the most recent swing low at 20,750 would be an early sign of weakness. A breach of this level could open up a slide to the major support zone highlighted in the chart.
The short-term outlook remains bullish, and the Nifty 50 index could head to the immediate target of 21,800-21,950. Only a breach of 20,750 would invalidate this view.
While the assessment of the price chart is definitely bullish, there are a few red flags popping up if one considers the medium to long-term breadth indicator of the Nifty 50 index. We will stick to the PF-X% breadth indicator to assess the overall health of the market. This breadth indicator in 1% box size (capturing short-term breadth), is currently in the neutral zone, supporting the case for a rally to the immediate target zone of 21,800-21,950.
The problem, however, is the breadth in the medium to long term perspective. There are two indicators to note here:
- The PF-X% breadth indicator in 3% box size (capturing medium-term breadth), remains overbought at 92%. It is pertinent to note that this indicator has been in the overbought zone since the first week of this month. Theoretically, the breadth can remain elevated at the overbought zone for an extended period too. But remember, it does not remain at the overbought zone forever. A time or price correction would happen sooner than later to trigger a cool off in the breadth.
- The PF-X% breadth indicator in 5% box size (capturing long-term breadth) has been in the overbought zone for almost 6 months now. This is the signal that breadth can remain overbought for extended periods; but a look at the historical precedence suggests that the price fall has been brutal in many instances when the long-term breadth begins to cool off from the overbought zone.
The other interesting aspect is that of seasonality. Historically, the first month of a new calendar year has not been particularly bullish for the equity markets. A look at the data from the year 1996 till 2023 indicates that the Nifty 50 index has delivered negative returns in 16 of the last 28 Januarys, with an average return of -0.24%. The Nifty 50 index recorded a 2.45% fall in January 2023 & 2.48% in January 2021.
To sum up – price wise, there is nothing to worry for the bullish camp. We are not terribly overbought yet based on the price action. But the elevated reading in breadth indicators is something to be mindful of. Along with the breadth, the seasonality factor is also something to be wary of.
Ideally you must be fully invested by now and enjoying the benefits of the recent run-up in equity markets. If so, be mindful of your exit plan (and if you do not have an exit plan then this is probably time to build one). Remember, the quality of your exit determines the returns you generate. Until you exit, the profit would remain fictional. So, focus on how you would deal with your existing portfolio in terms of exit.
Outlook For 2024
Now that we are in the home stretch for 2023, it would be in context to talk about the outlook for the next year. Have a look at the weekly chart of the Nifty 50 index posted below.
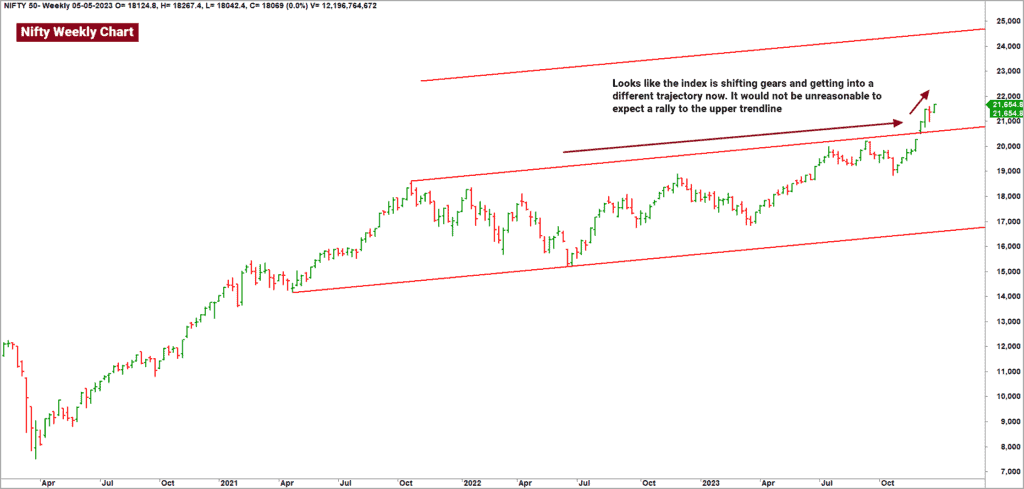
As highlighted in this chart, the Nifty 50 index seems to be shifting trajectory. In our experience in dealing with such range-shifts, we have noticed that the price has a high probability of reaching the equidistant channel line on the higher side. By that yardstick, it would not be outlandish to consider a move to the upper line at 24,000+.
Remember, there is no compulsion for the price to hit this target before the end of 2024. It may happen next year or anytime thereafter. This target would remain valid as long as the price sustains above the lower channel line at 16,900-17,000.
Let me reiterate that this is a medium to long term target and do not expect a linear rush to this level within the next few months.
Let us now shift focus to a few interesting sectors and then to the broad market.
Nifty IT Index
The Nifty IT Index has been setting up well recently. It may be recalled that this index has been a rank underperformer for several months now. The recent price action along with the consistent improvement in the sector breadth suggests that there is buying interest creeping into this sector.
However, the relative performance of the IT index in relation to the Nifty 50 index is not convincingly bullish yet. I would prefer to wait for concrete evidence of improvement in the relative performance before considering any exposure in the IT space.
It would be pertinent to highlight that the Nifty IT index represents the large cap names from the universe. But the small & mid-cap stocks from the IT sector have been performing well for a while now. The Nifty MidSmall IT & Telecom index is an interesting option to consider in this context. The price performance of this index and the relative performance versus Nifty 50 is impressive.
Nifty PSU Bank
The Nifty PSU Bank index has been a star performer since July 2023. However, there are signs of weakness creeping in, especially in the relative performance of this index in the past few weeks. A look at the relative performance chart of the PSU Bank index versus the Nifty 50 suggests that the PSU bank index has been struggling to sustain its outperformance that was evident until October 2023. This index was an outperformer between July to September and has struggled to display any meaningful outperformance in the past couple of months.
The swing low at 4,600 is a crucial reference level for the Nifty PSU Bank index. A breach of this level would indicate bearishness. Avoid fresh exposures in this sector until there are signs of resumption of the prior outperformance. A breakout above 5,950 would be a sign of resumption of the prior outperformance.
Other sectors
The Nifty Metal, Nifty PSE, Nifty Phama & Nifty FMCG sectors are all also setting up well. Of this lot, the PSE Index has been an outperformer for several months now and remains one of the bullish sectors. But again, the PSE index is getting into the overbought zone; be wary of enhancing exposures at these levels. Remain invested and focus on the exit plan for the holdings in this sector. The rest of the pack – Nifty Metal, Pharma & FMCG look interesting. Look for short-term opportunities from this space.
Nifty MidSmall Cap 400 index
We have maintained our positive outlook for the broader markets for several months now. The Nifty MidSmall Cap 400 index has been in a strong uptrend and remains an outperformer versus the Nifty 50. There is nothing technically to suggest a reversal of this bullish trend in price and relative performance.
A fall below 13,300 would be an early sign weakness and would warrant caution. The broader markets remain the focal point of interest. The mid & small cap space is where the action is. As observed earlier, you must be fully invested in this space by now. The risk-reward is definitely not favourable to initiate or enhance exposures at these levels.
The recent price action in the broader markets is remindful of the year 2007. Those who were in the markets back then may recall the mad run witnessed in 2007 and the meltdown in the subsequent year.
I firmly believe that an extraordinary market condition is a prerequisite to generate extraordinary returns. So, let us enjoy the party until it lasts! But be mindful of not letting the enjoyment turn into a nasty hangover.
Those who like to study and draw lessons from history may take a look at the euphoric rise in the IT & telecom stocks prior to their peak in the year 2000. Also, look at what happened to those stocks in the correction that commenced in the year 2000. Look at the charts of Infosys & Wipro in particular. If you wish to dig deeper, then take a look at the monthly chart of precious metals (silver in particular) prior to and after the Hunt Brothers crisis in the 1980s. Also check crude oil chart during 2003 to 2008 and what happened thereafter.
All the examples cited above clearly convey the message that euphoria may persist beyond our imagination. But remember the subsequent sell off will be equally brutal. So, always have an exit plan and remember to execute it.
As always, we shall come up with timely updates on short-term changes in our equity market outlook.


8 thoughts on “2024 Technical outlook – What the new year could bring”
Thanks again for a quick response, Krishnakumar ji!
I meant I was tracking a 50 day SMA but my message says 5 day SMA – my bad.
I had some tactical position it since the time you indicated; shall continue holding it, keeping an eye on 50 day EMA.
~Arun Kumar M S
Thank you for the article . My query is if you could elaborate from an asset allocation perspective as to how should the mix between equity , debt and gold should look like given the current conditions. Thanking in advance.
Hello!
Observations on Medium to Long term appear mixed & hence perplexing. You state that they are in an overbought zone & inform that they may not remain that way for very long – indicating a potential correction. Meanwhile you also indicate that for the same time range, Nifty could hit 24+ k. It’s confusing, for me.
The narrative on IT space seems to indicate taking exposure to MidSmall IT & Telecom index. Can you pl. Recommend/point to any ETFs or funds in this space.
For short term exposures to Nifty Pharma, what may be a reasonable upside expected to set up “book-profit” calls.
Hello Arun Kumar,
The target of 24k+ for Nifty is from a medium to long-term perspective. The breadth being overbought and markets being vulnerable to a potential correction is from a short-term perspective. There are two ways in which this scenario can play out.
The extreme Bullish Scenario:
Nifty can sustain its current bullish fervor and head to the 24k+ target straightaway. This is even more dangerous, accordingly to me, because the price & breadth would then be pushed further into to extreme zone and the scope for a sharp price reversal is much higher. I rate this scenario as relatively lesser probability one.
The Less Bullish Scenario
In this scenario, the breadth can cool off either via a price correction – meaning Nifty can fall by 5-8%. Or, the breadth can also cool off via prolonged & volatile range bound price movement. Once the breadth cools off, the stage could then be set for the rally to the long-term target of 24k+.
Let me reiterate (I have made it clear in the copy too) that this move to 24k+ will not be linear and is unlikely to happen in a hurry. I will be pleasantly surprised if it does so.
Regarding Nifty Pharma index, I would expect 8-10% upside in the index in the short-term (8-12 weeks). Use the 50-day moving average as your guide to exit the short-term holdings. Any charting software platform will let you plot the Nifty Pharma index with a 50-day simple moving average. Exit when the Nifty Pharma index closes below its 50-day moving average.
Thanks
B.Krishnakumar
Appreciate the detailed response, Krishnakumar ji 👍🏻
Thanks!
Couple of follow up queries & a request:
1. Will the thumb rule (if the day closing value < 50 SMA) apply for any time-bound short-term/tactical investments?
2. My older query on options for investment in MidSmall IT & Telecom index.
Coming to the request; Going forward if you may include such indicative detail for (time range & possible expected up-tick for short-term/tactical investments) it will indeed aid.
Once again, many thanks!
Hello:
The moving average can be an effective and objective way to manage short-term or any time-bound tactical investment. But the choice or the length of the moving average would depend on your definition of short-term time frame. For any investment which you may want to hold for anywhere between say 6 months to a year, then 50-day SMA could be a relevant tool. For higher duration holding period, you will have to increase the moving average length accordingly. 50-day, 100-day & 200-day are among the popular choices, of course based on your investment horizon.
2. Going forward, I will include expected target (indicating upside potential) and the time frame.
Regards
B.Krishnakumar
Hello Krishnakumar ji,
The Nifty Pharma seems to be keeping the upside momentum since the time indicated it. May I continue to hold this “tactical position” keeping an eye on the 5 Day SMA? Pl. opine.
Thanks indeed.
~Arun Kumar M S
Hello Arun Kumar,
The Nifty Pharma index is bullish and positioned at all time highs. If you are already invested in this sector, then use a 21-day exponential moving average as your exit criteria. If the price closes below its 21-day exponential moving average (EMA), then exit the holdings. This suggestion of 21-day EMA is relevant for a short-term trader (holding period of few weeks to say 4 months). If you want to stick around for longer, then choose a slightly longer moving average like 50-day EMA.
Else, you can also plot the Super Trend indicator which is a more elegant way to trail stops as this indicator has an inbuilt element of volatility factored in. Use the default settings of this indicator in the daily chart. Most broker terminals and free charting platforms like Tradingview.com will offer facility to plot charts with EMA or super trend indicator.
Hope this helps!
B.Krishnakumar
Comments are closed.