
The year 2020 will go down as a historical one for the stock markets for more reasons than one. If COVID-19-triggered crash in March 2020 was dramatic, the subsequent rise was even more remarkable. If someone had predicted at end of March 2020 that the frontline stock indices would close at lifetime highs by December 2020, I am sure there would not have been too many takers for it.
But that is what Nifty 50 and BSE Sensex managed to achieve. The Nifty 50 index posted a gain of about 84% from March lows of 7,610. Quite a few stocks from the large cap and mid-cap space gained in excess of 100% during this period.
The investing community too got polarised in 2020. There was a camp which got on board by increasing their equity exposure after the March crash while others either did not find the logic or the courage to do so.
As Michael J. Mauboussin says in his much-acclaimed book – The Success Equation, stock market trading / investment is something that is luck-driven and that’s why one should have a process driven approach. Traders who adopted a process driven approach would have definitely participated in the stock market recovery that happened post March 2020 crash.
So, after the rally, what’s ahead for investors in 2021? Being a technical analyst, I am not getting into questions such as:
- Is this rally justified based on fundamentals?
- How reasonable are the valuations at current levels?
- Is this irrational exuberance?
Not for a moment am I saying that these factors are irrelevant and should be ignored. What I strongly believe is that irrational market action, both on the way up and down, presents an opportunity to make above-normal returns. If everything was priced to perfection and behaving rationally, where is the scope for making money in the markets?
Enough said! Let us shift attention to the agenda for this post – the outlook for markets in 2021. This is a tough ask, but I arrive at my assessment based on a few metrics.

Base case
Whichever way you dice it, based on technical analysis of historical price action, the outlook is positive for the equity markets. Here are the reasons for the bullish view:
- Benchmark indices such as NSE Nifty 50 & BSE Sensex 30 are at lifetime highs
- Broader market indices such as NSE Nifty 500 or BSE Mid Cap Index too are at all-time highs.
- Market breadth indicators such as the percentage of stocks trading above their 200-day moving average are at healthy levels.
- In the Nifty 500 universe, close to 96% of the stocks are trading above their 200-day moving average. This indicates that the market rally has been broad based and not confined to a narrow set of stocks.
Having said this, what are some of the short-term targets for the market to keep in mind? Here is the Point & Figure chart of the Nifty 50 index. This is a short-term chart with relevant targets.
(Click on image to enlarge)
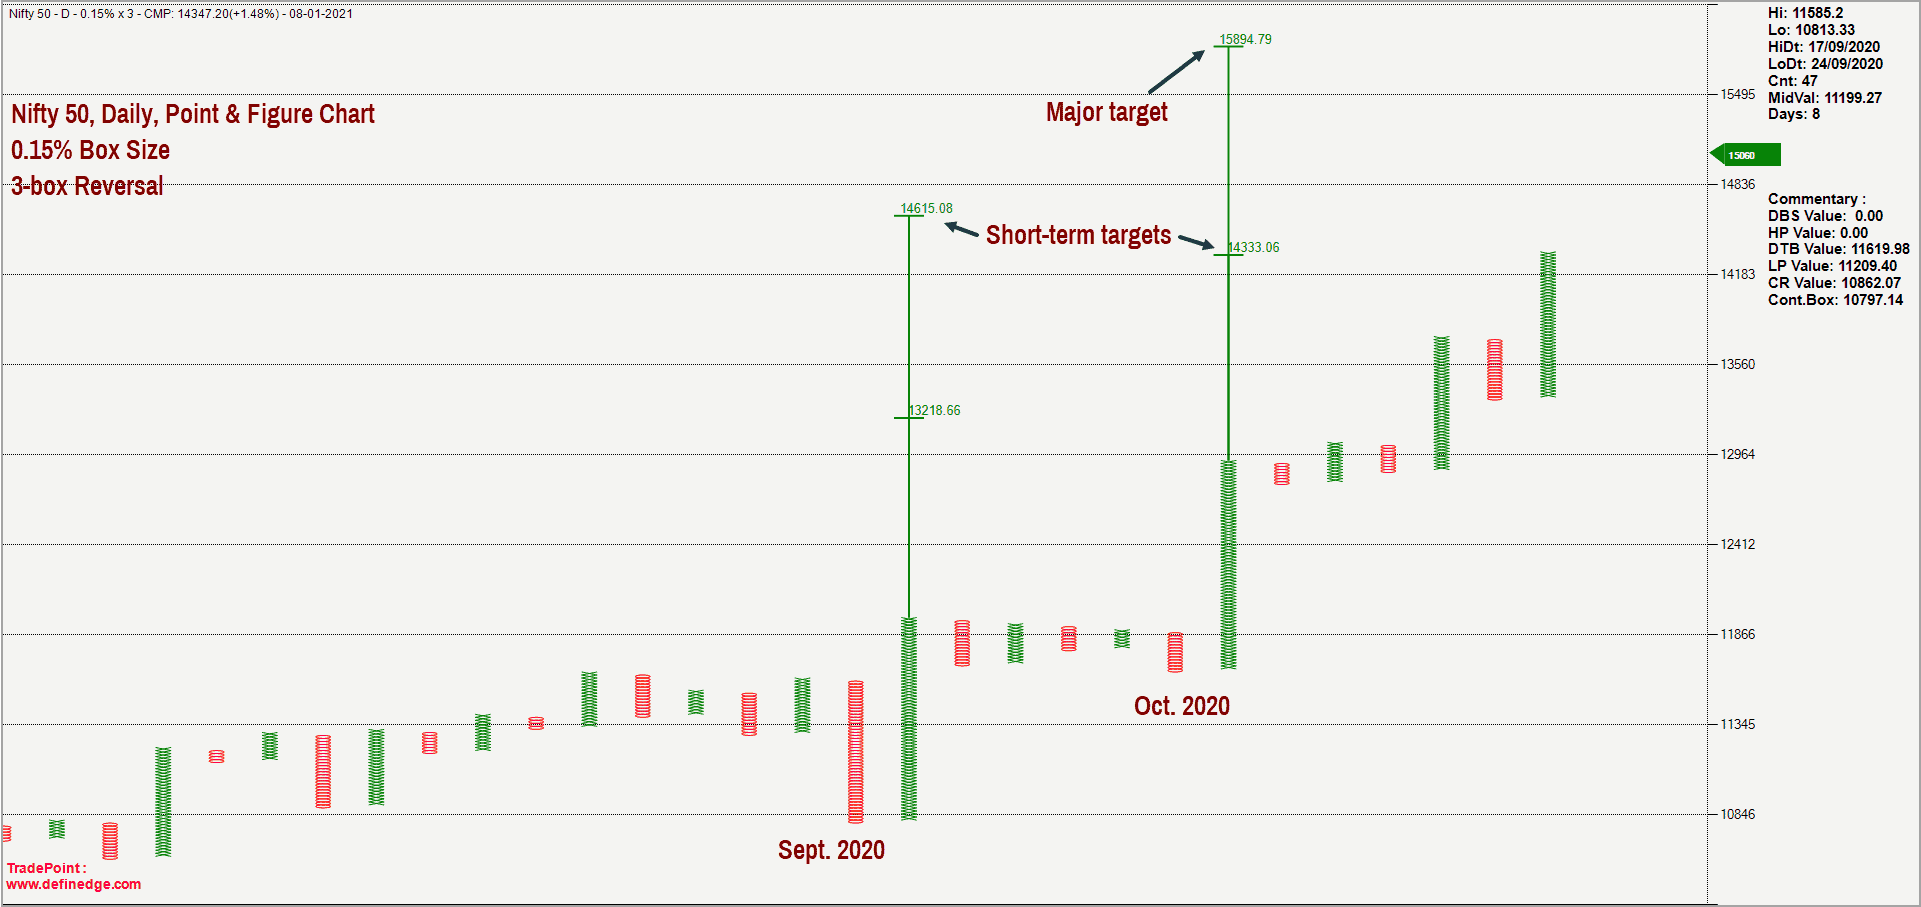
Based on this chat, the short-term target for the Nifty 50 index is 14,600 and the slightly longer time target is at 15,900. This target of 15,900 would be invalidated if the Nifty 50 index closes below 11,640.
The Nifty 50 index is cruising higher with a series of higher highs and higher lows which is a basic characteristic of an uptrend. While the chart patterns and the potential upside targets are indicative of bullishness, let us consider the other side of the coin too. Have a look at the daily chart of the Nifty 50 index presented in the Renko charting format.
For the uninitiated, Renko chart and Point & Figure are categories of charts which eliminate noise and capture only the price action that is considered significant. Let us begin with the 3% brick size Renko chart of Nifty 50 index. This is a proxy for the monthly or long-term chart of the Nifty 50.
(Click on image to enlarge)

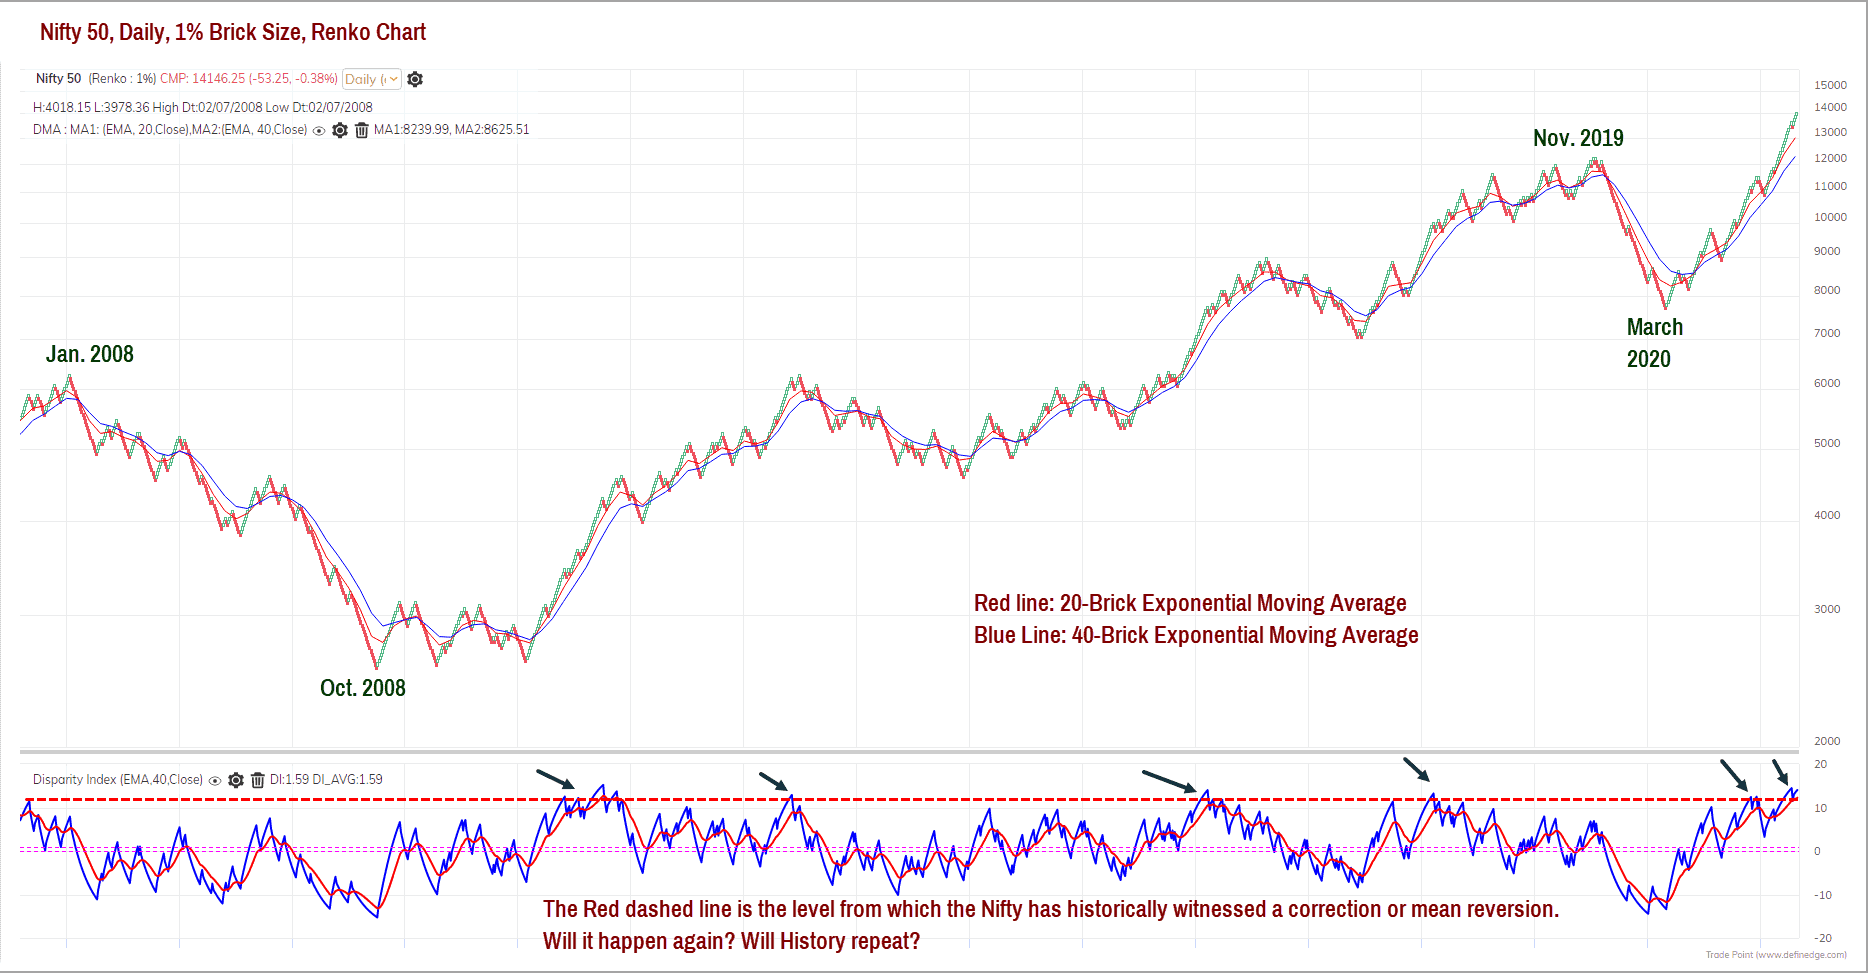
An indicator called the Disparity Index is plotted in the bottom pane in the above chart. The disparity index calculates the distance between the current price from chosen moving average and is expressed in percentage terms. For our study, the Disparity Index is calculated using the 40-Brick Exponential moving average.
The Disparity Index is at levels from which the Nifty 50 index has historically witnessed a fall or a counter-trending move. There is no compulsion that the Nifty has to reverse from historical extremes in an indicator as prices can remain extended for a while. But when trading or investing, it pays to be aware of reversal possibilities to position accordingly. Let’s now assess the Nifty 50 chart based on 1% brick size Renko chart which is a proxy for the weekly chart or a relatively shorter time frame.
(Click on image to enlarge)
Here again, the Disparity Index suggests that the price is at historical highs from which a correction has happened earlier. This calls for caution too.
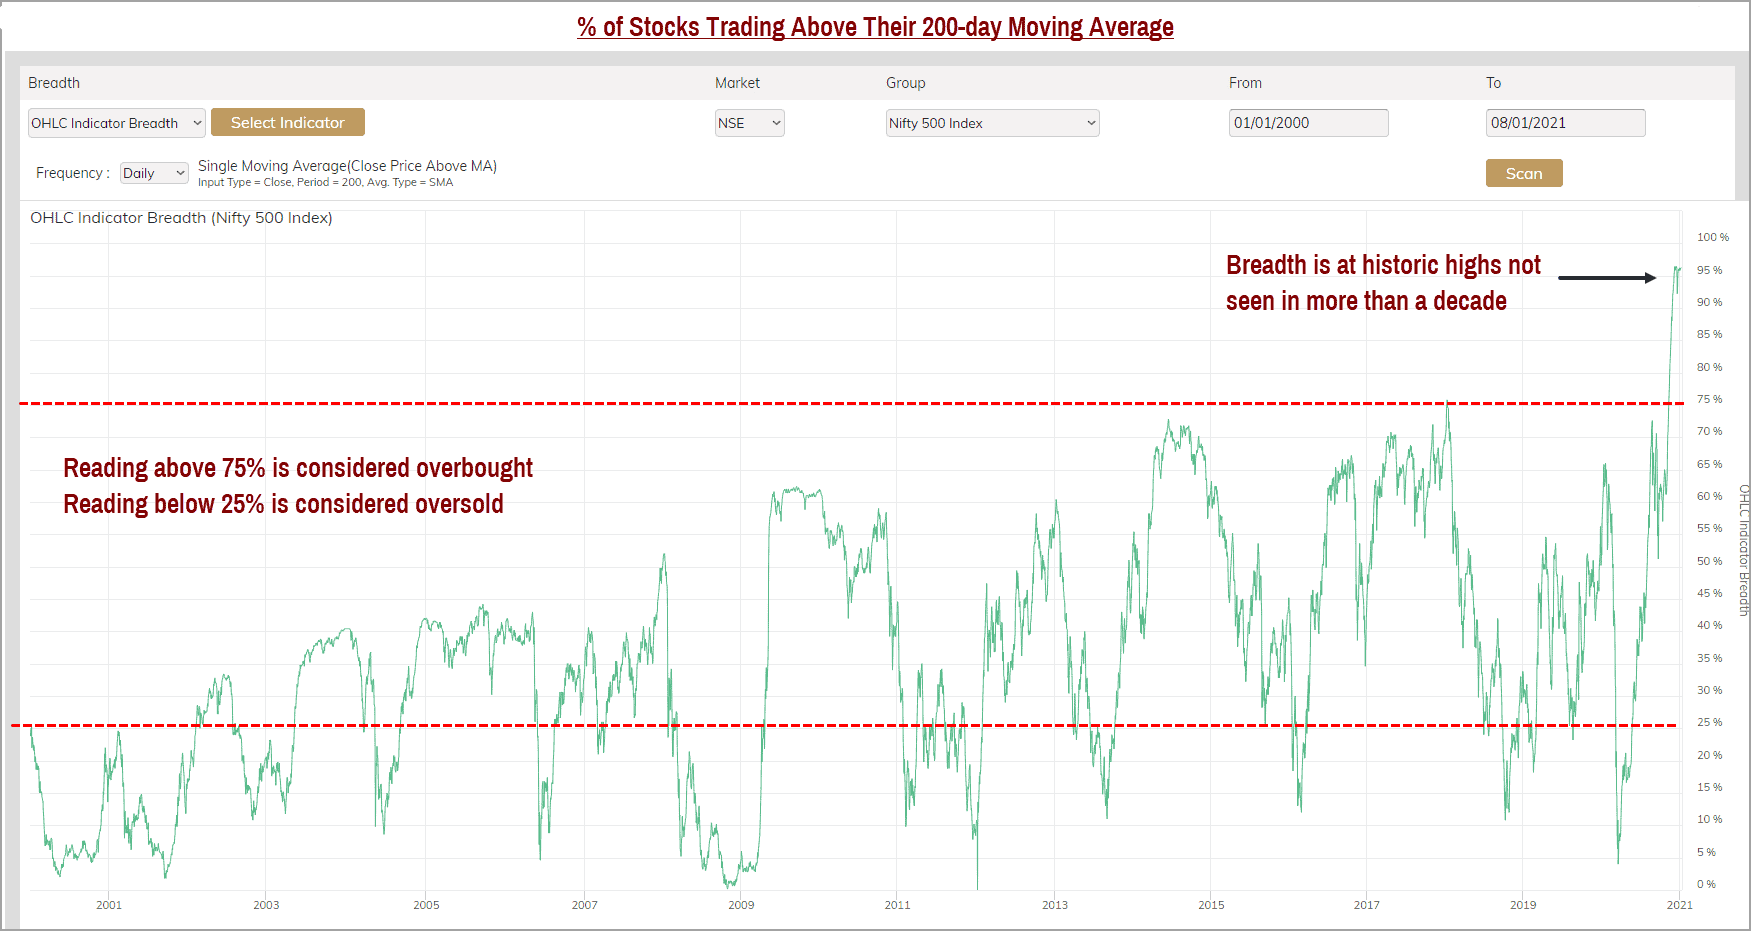
The breadth indicator measured by the percentage of stocks trading above their 200-day moving average is also at lofty levels of 96%. This indicator suggests that almost all stocks from the Nifty 500 basket (this index includes Nifty 50 stocks too) are above their 200-day moving averages which is a sign of markets being overheated. Traditionally, a reading in excess of 75% is considered overbought and below 25% oversold.
(Click on image to enlarge)
Where we stand
Taking a combined view from all these charts, from a technical standpoint, here is where we stand today.
- The trend is bullish for the Nifty 50 index and market breadth is healthy but overheated.
- Historically, significant market peaks have occurred in the month of January / February.
- The trend remains positive until the index breaches 13,300. As long as 13,300 is intact, expect Nifty 50 to achieve the target of 15,900.
- If the Nifty 50 index closes below the recent swing low at 13,370, it would be a first sign of danger.
- A close below 12,920 would push the Nifty 50 index below 40-brick exponential moving average in the 0.5% Renko chart. This would signal the start of a deeper correction or a reversal.
So how far will the Nifty 50 fall if it breaches 12,920? I do not have answer to this question now. This will be addressed in a subsequent post based on how the scenario pans out. Here is how one can deal with this market which is displaying bullish signs but is overheated.
What to do
Here are a few suggestions to deal with the scenario in an objective manner:
- As the market breadth is at an extreme, be cautious about increasing your equity exposure.
- You can continue your SIPs in mutual funds and the factors discussed in this post need not affect that.
- The broad trend is bullish as long as 13,300 is not breached.
- Any pull back close to this zone and a subsequent reversal could be an opportunity to increase equity exposures.
- Exit partially (how much depends on your process & exit plan) if 12,900 is breached.
Enjoy the party until it lasts. There is nothing much to worry about as long as the Nifty 50 index trades above 13,300. If you feel that as the reference level of 13,300 at 6% is too far away from prevailing Nifty levels, then you do not have the appetite for stock investing. A 5-10% pullback is par for the course in any normal bull market and one has to learn to live with this gyration to generate wealth.
We need a process-oriented approach to be successful in stock markets. So, choose a logical process for entry and exit and more importantly stick to it. This removes the anxiety and fear about what markets will do.
Also Read : Nifty Analysis on 7th March 2021


22 thoughts on “What the charts predict for 2021”
b krishnakumar As per your Technical Anlasys short term target achived now Sensex run for your long term target.
kindly write artical on current market for our guidance sir
Hello:
Will share an updated post on market outlook soon.
Thanks.
B.Krishnakumar
Comments are closed.