The author is an external contributor. Views are personal and do not reflect the opinion and views of PrimeInvestor.
In the previous update (Technical outlook: Can the resilience of the Nifty 50 continue?) we had shared a bullish view with an upside potential of 20,400-20,500. The index recorded a high of 20,222 and has since been in a corrective phase. In this update, we shall look at the short-term technical structure of the Nifty 50 index along with the study of a couple of outperforming sectors.
Nifty 50 short-term outlook
As always, we shall begin with a look at the daily candlestick chart of the Nifty 50 index.
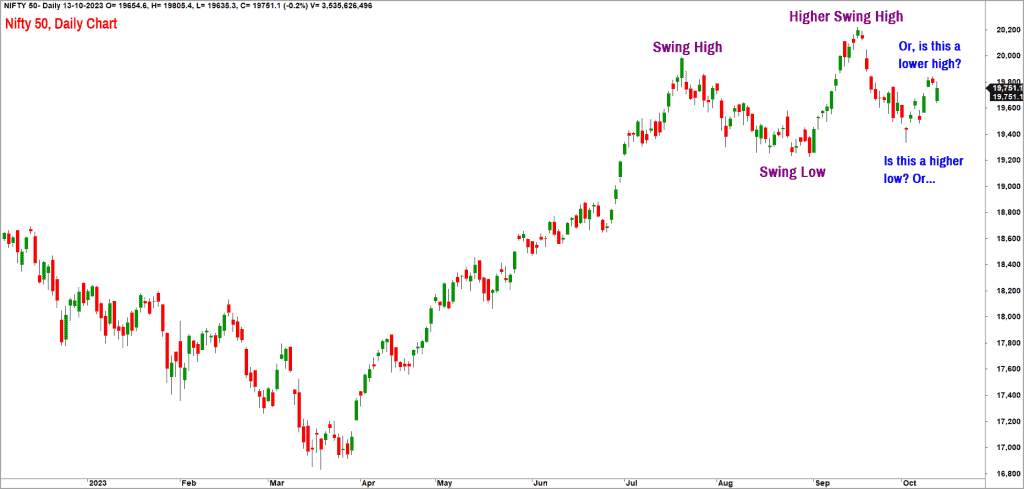
It is evident from the above chart that the Nifty 50 index still confined within the prior swing between 19,220 – 20,222. It would not be unreasonable to expect volatile sideways price action to persist until we get either a breakout above the swing high at 20,222 or fall below the swing low at 19,220. As observed in the previous update, the short-term outlook remains positive as long as the index stays above 19,200 and the index could head to the target of 20,400-20,500 range.
Let us also check the breadth indicator to understand what is in store.
We will stick to the reliable PF-X% indicator as our breadth indicator tool. This indicator tracks the percentage of stocks in a bullish swing in the Point & Figure chart. There are 3 observations here. One, the PF-X% in the short-term time frame has cooled off, and at 50% it is suggesting that it is not overbought. Two, it is positive to note that the breadth indicator has recovered to the 50% mark despite the volatile recovery witnessed from Oct 4 low of 19,333.
Three, the PF-X% breadth indicator in the medium-term time frame too has cooled off from the overbought zone and is currently in the neutral zone of 72%, which is an additional comfort. This suggests that majority of the Nifty 50 stocks are still in a bullish swing in the bigger time frame, despite the recent volatility and pull-back.
In this context, I wish to highlight another interesting data point that was shared in one of our previous updates (Technical outlook: Outlook now for the Nifty 50 ). The medium-term breadth indicator, measured by PF-X% breadth in the 3% box size in Point & Figure chart, is yet to reach the oversold level of below 25% in this calendar year. This indicator has reached the oversold level in 22 out of last 24 years, as highlighted in the post. It remains to be seen if 2023 turns out to be an outlier, similar to 2012 & 2019.
If history does repeat itself, it would not be unreasonable to expect the medium-term breadth to reach oversold levels this year too. Expect some serious cut in the Nifty 50 index if this scenario were to pan out within the remaining months of 2023. Of course, price has to fall below 19,200 before the breadth cool off can happen. So, we are looking at interesting times ahead.
To summarise, there is nothing the chart pattern or price action to suggest outright bearishness yet. A drop below 19,200 would result in a bearish sequence of lower highs and lower lows. In this scenario, there could be a possibility of the index dropping to the 18,650-18,700 range.
Nifty MidSmall Cap 400 index
Let us now move on to the broader markets. We have highlighted the strong participation of the broader markets and outperformance of the mid and small cap stocks in prior updates. The Nifty MidSmall Cap 400 index almost reached our target zone of 14,700-15,000. The index has been consolidating in a tight range recently and its performance has been at par with the Nifty 50 index in the past few weeks.
As observed in previous updates, the breadth indicator for the Nifty MidSmall Cap 400 index is still overbought at 88% suggesting caution. It may not be prudent to enhance exposures in the broader markets as the risk-reward is not favourable. A fall below 13,700 would be an early sign of weakness and this would also trigger a bearish sequence of lower highs and lower lows in this index. Enjoy the party until it lasts but be mindful of not overstaying.
Sector studies
Now, let us look at the other sectors.
Nifty Bank
The first focus is on the influential Nifty Bank index which has been a sore spot as far as the Nifty 50 is concerned. This index has a key role to play both technically and fundamentally. The Nifty Bank index has been an underperformer versus Nifty 50 since mid-May. There are still no signs of a reversal of this relative underperformance.
It is critical that the Nifty Bank index takes the lead in order to trigger a strong upside momentum in the Nifty 50. Have a look at the ratio chart of Nifty Bank index versus Nifty 50 featured below.
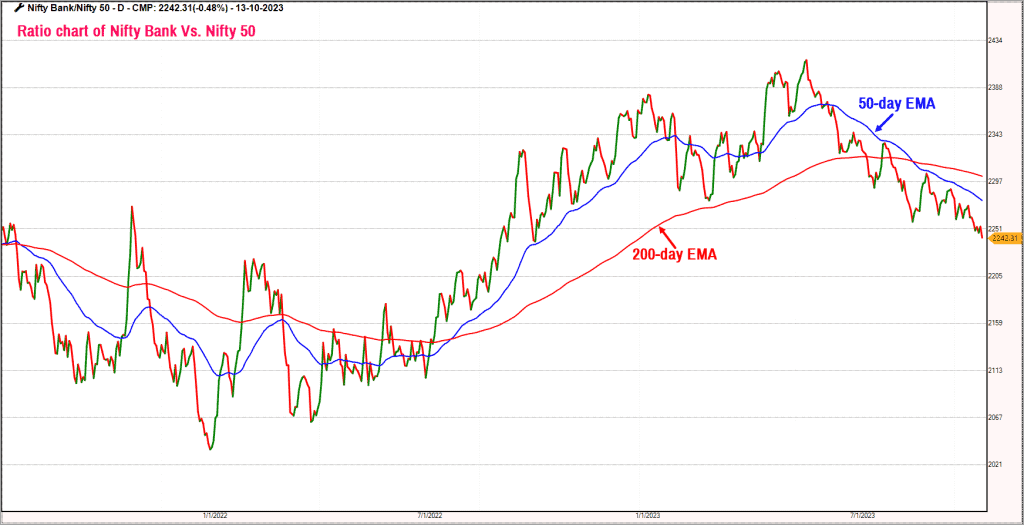
The ratio chart is clearly bearish, suggesting underperformance of the Nifty Bank index. The ratio chart is trading below the 50-day and 200-day moving averages and the 50-day EMA is below the 200-day EMA, confirming bearishness or strong underperformance.
A drop below the immediate swing low at 43,300 would be a major sign of weakness and could push the Nifty Bank index to the 40,800-41,500 zone. The index has to move past 46,300 to reinstate bullishness.
Nifty Realty
Now, let’s move to the Nifty Realty index, which has been showing relative strength. Have a look at the chart displayed below capturing the relative performance of various sectors versus Nifty 50. The chart captures the performance since the swing low recorded on March 28, 2023.
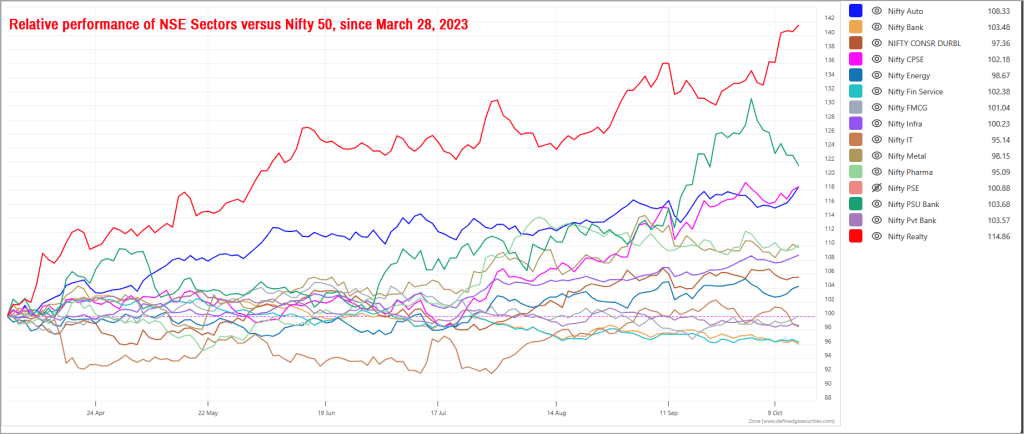
It is evident from the above chart that the Nifty Realty index has been the star performer, appearing right at the top the crowd since March 28. After a minor consolidation, this index has resumed its outperformance recently.
The technical outlook for this index remains bullish and there is a possibility of a rally to 700-720 range. A fall below 560 would be an early sign of weakness and could reduce the chances of a rally to this target zone.
As a word of caution, be extremely picky and focus on companies with sound corporate governance from this sector.
Nifty PSU Bank
From the relative performance chart featured above, you might notice that the PSU Bank index is placed second in the pecking order. This index too has seen a dream run recently. But there are signs of fatigue creeping in, evident from the sharp dive in the PSU Bank line in the above chart. This indicates that there is some profit booking happening. We will have to wait and watch to decipher if this marks the end of the relative outperformance or if the recent dip is a just a correction within an overall uptrend.
A look at the price chart of the Nifty PSU Bank index suggests that the overall trend is still bullish. The bullish view will warrant a reassessment if the index drops below 4,300. As long as this level is not breached, expect the PSU Bank index to reach the next target of 5,650-5,700.
Other indices
The Nifty Auto index and Nifty CPSE index have displayed a lot of promise recently and warrants a closer look from an investment perspective. While the PSU stocks have run up a lot recently, there still appears to be some steam left. Focus on high quality stocks, preferably with reasonable dividend yield from the PSU space.
The Nifty Auto index (blue line in the above chart) has displayed a sharp turnaround recently. This index is just 1% below the all-time highs recorded last month. The short-term trend is bullish for this sector and the index could head to the 17,500-18,000 range. The positive outlook for the Nifty Auto index would be under threat of the index falls below 15,500.
Stocks from the mining sector, too, have been attracting buying interest recently. Keep a tab on this sector, though there is no official index available for this sector. Also of interest are the stocks from the automotive tyre sector. Again, there is no index available for this sector either.


1 thought on “Technical outlook: Nifty 50’s short-term trend”
Presently NIFTy is at 19046 around 12 noon on 27.10.2023.
This fall is triggered by Israel vs Pakestine war and uncertainty
caused by that war.
Looking ahead I feel say by 2025 October
NIFTY will surpass 22500.
May be some stocks may go out of NIFTY and some may make a new entry.
J S Sudhakarudu
Comments are closed.