Note: Articles attributed to PrimeInvestor Research team are collectively researched, discussed, and authored by all members of our core research team made up of Aarati Krishnan, Vidya Bala, and Bhavana Acharya.

Last week, we suggested an asset allocation plan for these tough times and also mentioned some equity funds that suited current market conditions. We also asked investors to deploy their money in equities in a phased manner. But given that the Nifty50 is busy taking out new lows with stunning rapidity, what are the Nifty levels at which the market gets really cheap, or attractive to invest lumpsums in? This strategy note is an attempt to answer this question.
The strategy
While investing a big sum at a market bottom is every long-term investor’s dream-come-true, market bottoms are often crystal clear only in hindsight. When you’re in the midst of panic and mayhem, it can be very hard to identify such lows.
We don’t claim to know exactly where the market will bottom out. But as fundamental and long-term investors, there’s one guidepost that we thought we could use – Nifty50 valuations. Here’s an attempt to identify the levels at which Indian markets will trade either at fair value or below it, so that you can deploy your money at reasonable levels.
Do note the following:
- This is recommended only for investors who can take short-term losses for a better shot at returns over a 5-year plus horizon. This is not a substitute for your regular investments towards goals through SIPs, which must continue at all market levels.
- Do not liquidate emergency funds or money needed in the next 2-3 years to make such one-off investments.
- The strategy is not based on technical analysis. It uses valuation as a metric to identify approximate levels that are attractive to invest into the market.
Estimating the Nifty levels
The starting point for estimating attractive market levels is the earnings estimate. In this exercise, we used the Nifty50 earnings estimate for one-year forward (FY21) as a starting point to gauge good levels to invest.
Currently, research reports tell us that the consensus estimate for Nifty50 earnings for FY21 stands at about Rs 660. But past experience tells us that this is subject to fairly big misses. Today, the achievement of this number is highly uncertain given two key imponderables.
One, the impact of crude on the large oil and gas companies besides issues ailing the banking sector. According to a February earnings review report by Nomura (India Equity Strategy), the decline in oil prices and shrinking refining margins can hurt the Nifty50’s earnings by as much as 5% for FY-21.
Two, the business disruptions caused by the coronavirus outbreak will also take a toll on revenues as well as earnings. We are assuming a 5% earnings dent in FY21 on account of this.
Allowing another 5% buffer in addition to these risks will lead to Nifty50 earnings falling 15% short of the current number in FY21. Thus, the discounted FY-21 earnings per share for the Nifty50 comes to Rs 561.
Having arrived at this EPS, the next step is to guess the likely PE at which the Nifty50 will be either at long-term averages or below them. Here, we used the history as our guide. In severe bear markets like 2008, Indian markets bottomed at forward P/Es close to 7-8 times. But the 15-year average forward P/E for the Nifty50 is about 15 times. Based on these indicators, here’s a matrix of the Nifty50 levels which may be good entry points for investing lumpsums into equities.
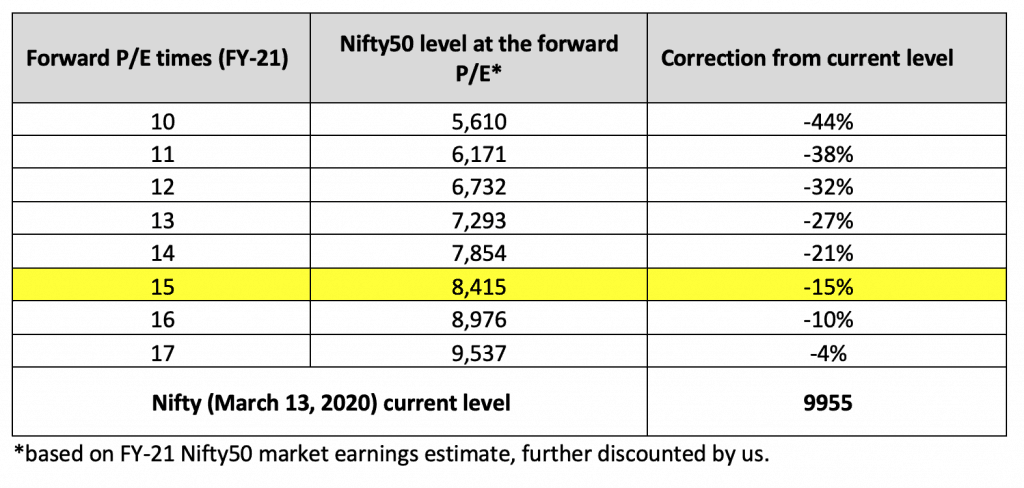
What the table above tells is that the Nifty 50 would need to touch around 8400 levels (please don’t measure the exact level, and allow for a deviation of at least 1 percent) for you to deploy at the long-term average P/E of 15 times. That means another 15% correction from here. In other words, meaningful valuation-based deployment can happen post that.
Since we cannot be sure how deep the correction will be, you could use the following as a guidepost:
- Invest one tranche at the current levels since it is close to a 20% correction from January 17, 2020
- Invest a second tranche when the P/E moves to the long-term average territory of 15 times forward
- Invest the maximum proportion below 15 times (below Nifty 8400 levels).
What if the correction isn’t that deep? It is okay because the markets may test recent lows multiple times over the next few months and you would anyway be investing through SIPs.
Please note the following:
- The P/Es are forward fiscal earnings estimated by analysts and further reduced by us. These earnings can well be downgraded further. This is the reason we went with lower P/E and Nifty levels.
- The Nifty levels above are NOT based on trailing P/E. So just look for the Nifty levels we have mentioned.
Where to invest?
Even if you know the right levels to invest, deciding what stock to pick up can be difficult, especially if you need to react with lightning speed. The lows of the past week also tell us that it isn’t easy to buy individual stocks, even if liquid, in the midst of mayhem and panic.
However, there are still good alternatives to buying individual stocks at market lows. Simply buy the market itself through index funds! You can invest in the Nifty 500 or in a combination of Nifty 50 and the Nifty Midcap 150. Please note the difference in returns in this combination has not been high, with latter (the Nifty plus Midcap 150 in a 70:30 mix) delivering just marginally higher returns in the past.
| Option 1 | Allocation | Comment |
|---|---|---|
| UTI Nifty 50 index fund or Nippon India ETF Nifty BEES | 70% | 5-year returns of this combination has beaten the Nifty 500 100% of the times by an average 0.63%, from 2005 onwards (data available since then for the Midcap 150). We took the primary largecap index where you can be certain of staying with market flavor. We took the midcap index that can deliver some alpha from the 101-250th stock by marketcap. To this, we applied various allocations (50:50, 60:40 and so on) to arrive at the one with the highest certainty of beating the Nifty 500. This combination can also deliver higher in the initial leg of the rally when the upside is limited to quality bluechip stocks from the Nifty 50. Volatility in this portfolio can be marginally higher than the Nifty 500. |
| Motilal Oswal Nifty Midcap 150 fund | 30% |
| Option 2 | Allocation | Comment |
|---|---|---|
| Motilal Oswal Nifty 500 Fund | 100% | This index delivered an average 13.2% annual return on a 5-year basis when returns were rolled from the year 2000. This index holds potential to deliver better in a broad market rally. It’s akin to buying the entire market. However, it may underperform if the initial leg of the rally is restricted to select large caps. Since it goes beyond the 250 stocks in option 1, the rest of the index, albeit smaller in allocation, can beef up returns a bit over the longer term. |
Please refer to our Prime Funds section to know more about the index funds mentioned above. At this juncture, it is hard for us to pinpoint which option works best. What we know is that historically their difference has not been high. So, use one of them as a proxy for buying the market.
Please note that this strategy does not guarantee downside protection in the near term. You need a minimum 5-year time frame for it to pay off.