When talking about investments in a mutual fund or a portfolio of funds, one of the most important and also widely misunderstood terms is ‘returns’. Our earlier article on the different types of returns and how one should and should not use them can be found here.
This article delves into the ‘XIRR’ or extended internal rate of return and how it can be the best way to arrive at the returns on your portfolio that is unique to you, because two people can invest in the same fund but have very different returns.
What is XIRR?
XIRR is a very handy spreadsheet function that calculates the internal rate of return for a set of non-periodic cash flows – i.e., cash flows that are not occurring at fixed intervals of time (this is why the XIRR is preferred over IRR, since the IRR needs steady periodicity in cash flows). For this reason, it is the best way to arrive at the returns on investments in a fund or a portfolio of funds / investments, since investments can be made on any day.
The XIRR function does the computation by trial and error and so there is no equation or formula with Greek letters that can be memorized to compute XIRR by hand or even with a calculator.
The only data points that are needed are the investment and redemption (or current value) amounts and the corresponding dates. The interval between the investments need not be uniform and the amounts need not be the same. There can even be multiple investments and redemptions interspersed with one another.

Using the XIRR function in a spreadsheet
The XIRR function is fairly straightforward to use and is only particular about two things.
- The transactions have to be entered with valid dates. The dates have to match the transactions in the same row. (It is not mandatory to enter the transactions in chronological order and as long as the transaction value matches the date in the row, XIRR will be computed correctly).
- Investments have to be entered as negative values (as they are cash outflows for you). Redemptions (as they are cash inflows, bringing money back to you) have to be positive values. Use the current value if you are still invested.
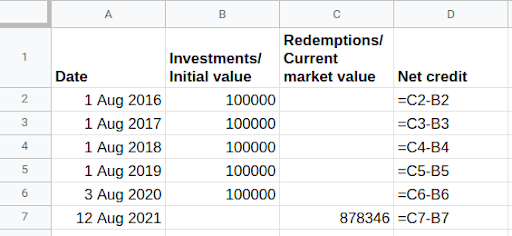
Let’s look at an example of yearly investments in a mutual fund with a current market value of Rs. 8,78,346 as of 12th Aug 2021.
To calculate XIRR for these transactions, the data points have to be arranged keeping in mind the two points above. If you would rather not show investments and redemptions (or current market value) as negative and positive numbers, you could just enter them as absolute values in separate columns as shown below and have a column (column D in the example below) to convert them to +/- as the case may be with a simple formula. This has been demonstrated for you below.
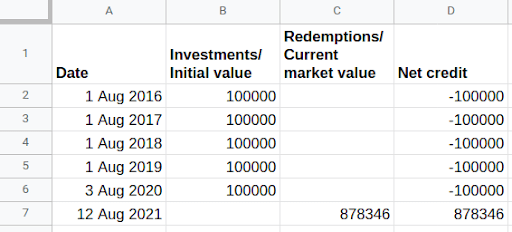
The above would result in values as shown in the image below.
The final step is to enter the XIRR function which needs two inputs - cash flow amounts and cash flow dates (which can be found in columns D and A respectively).
The excel formula, XIRR(cash flow values, dates), will get you the IRR for this set of transactions. For the above example, the formula would be =XIRR(D2:D7,A2:A7).
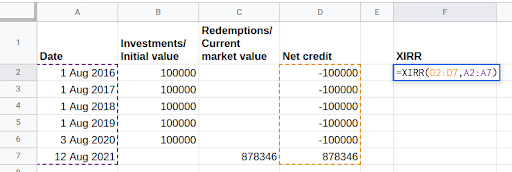
(Please note that you could also directly feed in the numbers using the appropriate +/- as in column D and skip columns B and C.)
This gives us the XIRR of 19.21%, which is the return from the investments made in this fund.
Computing returns for a specific period
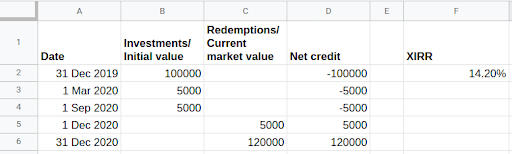
The XIRR function can also be used to arrive at the returns for a specific period of time, like the year 2020. We just have to make a few tweaks to the above illustration. Let’s assume you have an investment in a fund that has stayed invested for several years and the market value as of 31st December 2019 stood at Rs.1 lakh. Additional transactions were done during 2020 as follows.
- Invested Rs. 5,000 on 1st March 2020
- Invested Rs. 5,000 on 1st September 2020
- Redeemed Rs. 5,000 on 1st December 2020
Market value as of 31st December 2020 stood at Rs. 1.2 lakh.

The same spreadsheet and XIRR function can be used to compute the returns for the year 2020 by simply treating the market value of the investment as of 31st December 2019 (the start of the time period you want to compute returns for) as an investment made at the start of the year. All of the other steps remain the same. For this example, you should arrive at an XIRR of 14.2% as shown in the image below.
Our handy template
Alternatively, if you want to make things a little easier for yourself, simply download our readymade template spreadsheet below, which has XIRR and cash flow equations pre-filled up to 500 rows. All you need to do is enter initial and final market values and transactions during the period, along with their corresponding dates. You don’t even have to worry about the plus and minus signs for redemptions and investments because our template will take care of that for you. Just enter the investments in the column titled ‘Investments / Initial Value’ and redemptions in the column titled ‘Redemptions / Final Value’.
XIRR Calculator (Excel download)
XIRR or CAGR?
While reading up on any fund, you would have come across 1-year, 3-year, and 5-year returns. These are compounded annual growth rates or CAGR. A 5-yr return of 17% CAGR would mean that an investment of Rs.100, made 5 years ago, would currently be worth Rs.219 (compound interest of 17% for 5 years). However, this would only hold true if you invested a lump sum of Rs.100 in the fund 5 years ago and have not made any additional investments or redemptions since.
Most often this is not the case and if you, like many others, have made multiple investments into and redemptions out of the fund, CAGR will no longer be the right metric to use to arrive at an accurate returns figure. This is where the XIRR function wins with its ability to smooth out the effects of various inflows and outflows and compute a single rate of return.
XIRR for Portfolio Returns
Just like it is unlikely that you have a lump sum investment in a mutual fund with no activity until you hit the 1, 3, or 5-year mark, it is also unlikely that you have investments in just one fund (in fact, you probably shouldn’t!). You could have investments in one fund that is performing exceptionally well but there could be losses in another fund that are eating away the gains made and it is important to see how your portfolio is performing as a whole. Here too, XIRR will be the best way to understand overall portfolio returns.
Tip : If you are looking to arrive at the returns of your mutual fund portfolio, you can get the portfolio valuation as on a specific date from the consolidated account statement from Cams or Kfintech. Go ahead and take a look at how your portfolio has performed in 2020 – a year like no other.
To apply the XIRR metric to a portfolio of funds, note the following:
- You do not need to calculate the XIRR for each individual fund. A portfolio’s XIRR is not the average of the XIRR of your funds (yes, even if you take a weighted average based on each fund’s share). Calculating the XIRR for an investment needs the date-wise inflows and outflows – in this case, it is your entire portfolio for which you want the returns. A fund’s weight will constantly change based on when you invest, how much you invest, and how the fund performs. Essentially, treat the full portfolio as an investment with inflows and outflows.
- You need to enter all of the inflow and outflow (or current value) details, with corresponding dates for the entire portfolio, irrespective of the fund that the transaction pertains to. Then apply the XIRR function to the entire set of transactions. This will give you the aggregate IRR for your entire portfolio.
- Treat any redemption in a fund as an outflow for your portfolio. If you reinvest the money, it will be an inflow for the portfolio. Simply put these redemptions and reinvestments with the corresponding dates. This will take care of any fund-level changes you’re making to your portfolio.
Still confused? Here's a very simple example.
You invested in Fund-1. Then you later switched it to a different Fund-2, and again later redeemed it completely; The transactions are given below:

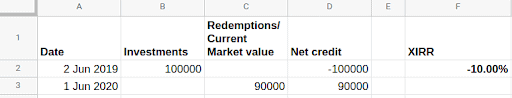
Fund-1
2019-Jun-2: invested Rs 1 lakh
2020-Jun-1: (completely) redeemed Rs 90 thousand
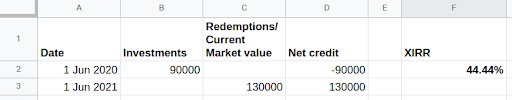
Fund-2
2020-Jun-1: reinvested Rs 90 thousand
2021-Jun-1: (completely) redeemed Rs 1.3 lakh
The XIRR for each fund and the portfolio can be calculated with the XIRR calculator spreadsheet.
XIRR of Fund-1: -10%
XIRR of Fund-2: 44.44%
XIRR of portfolio: 14.02%
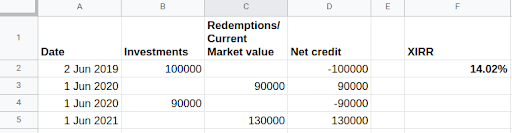
As you can see, for one, the average XIRR of the two funds is 17.22%, which is not equal to the portfolio returns of 14.02%. Even if you had, say, a third or fourth fund, the average of these fund returns will not be the same as your portfolio. Two, any redemption and reinvestment you make is automatically factored into the portfolio returns.
Therefore, all that a fund XIRR and a portfolio XIRR needs is a fairly simple process of inputting all investments and all redemptions date-wise. Of course, the more the transactions, the more the work you have in putting all these details in!