If I asked you how much you wish to earn in a deposit and in an equity fund, your response could be 7-8% on your deposits and say 12-15% on your equity fund (or thereabouts). If I asked you why your return expectation is so different for the 2 options, your simple response would be that equities are high risk and therefore you expect a higher return. It sounds very intuitive, doesn’t it?
In effect, your expected return on equities was a sum of the risk-free rate (assuming your FD is risk free) and a risk premium you have attached to compensate for the risk of losing your money in equity.

Given that this is the season for sports, I am borrowing this from a popular US-trading platform Robinhood (quoted), to explain the concept of risk premium:
‘In basketball, ordinary baskets are worth two points. But if you make shots from further away, beyond a line painted on the court, you get three points. You’re taking on more risk of missing the basket than if you had shot from closer to the basket, so you get more points if you make the shot. Similarly, the equity risk premium is the extra return you could get for putting your money into stock investments with greater risk than very low risk investments’.
In this article, we’ll explore where risk premiums come from in debt and equity. This is important because risk premiums are not fixed and change with time. So, if you base your return expectations wrong, you may wind up with a different corpus that you originally planned to.

This is an article for investors with basic to intermediate knowledge of bond and stock market. This will NOT give you any ready answers on a fixed number for equity risk premium or a fixed return expectation. This will tell you how to arrive at one. Just setting the article premise clear 😊
De-jargonizer
Whenever we mention risk premium in the context of debt, we mean the credit risk premium or the credit spread. This is the residual yield (till maturity) of an instrument over a risk-free instrument (typically treasury bill for short term or gilt for long term), for the same period. Our discussion is not about the risk premium you pay for holding different duration funds. It is restricted to the ‘credit spread’.
In equity, the risk premium is the difference between your ‘expected return on an instrument’ and the risk-free rate (same as mentioned above).
As a lay investor, it is fine for you to consider the FD rate from a large bank (not the high interest paying banks) as your risk-free rate.
Risk premium in debt
We typically assign a lower risk premium to debt investments than to equity. A debt instrument is a promise to repay you within a fixed period (there are exceptions like perpetual bonds but set that aside for this discussion) with a fixed amount. Your period of risk is finite and your compensation (interest) for such risk is fixed and known. In the event of a default, you either have a recourse, or you at least stand ahead of the equity investors in the repayment queue (like DHFL!).
For these (simplified) reasons, your expected return from debt and therefore the risk premium is lower than that of equity.
The risk premium in debt can be quantified much better than in equity. This is because of 2 data points:
- you know cash flows (interest/coupon) from the bond
- and you know the tenure of the bond.
So, it is possible for you to calculate the returns from the bond (yield to maturity). You can compare this with a risk-free instrument yield (treasury bill or government security/gilt) of similar tenure. The difference is the risk premium of the corporate bond over a risk-free rate. This is called the ‘spread’.
The credit standing of a company, its own business prospects and risks, the tenure of borrowing as well as structural risks in its industry and the credit scenario in the economy as a whole, can all influence this risk premium.
For example: Let’s take a 5-year gilt whose yield is currently 5.69% (as of July 23). Compare this with a similar-tenure AAA-rated corporate bond where yields are about 5.92%. The difference of 0.23% is the risk premium you assign for the additional risk that you take in a corporate bond over a risk-free sovereign bond. Now, if you take an AA-rated corporate bond, this spread widens to as much as 3.5%. This is because an AA-rated instrument has a higher risk of default than a AAA. So, the market assigns a premium to undertake the risk.
If you call the volatility that is brought about by the change in interest rate cycles as a risk, then you earn a premium for that risk too. But this risk has a lot of external factors involved –inflation, fiscal deficit, GDP growth, currency movements and so on. And it rewards or depreciates an instrument based on the residual maturity. We prefer to call this ‘volatility’ as this risk diminishes with time, as rates move up and down in cycles. But the risk premium coming from default risk can be very real and may not fade away with time.
Features of risk premium in debt
Here are some of the key features of risk premium in debt and the learnings. These are norms but can be broken by outlier events.
- Different risk premium: you associate different risk premiums to different debt instruments based on their credit standing. This is why a covered bond or an AA-rated NCD in the market has a higher interest rate than FDs from Sundaram Finance or HDFC. For traded instruments, this is reflected in their traded yields. At the same time, you cannot expect a high quality AAA-rated bond to yield far higher return than a FD. Remember, unlike equity, there is no unlimited upside in debt.
- Tenure: The risk premium is higher in longer tenure because there are more uncertainties in the long-term.
- Economic environment: In a deteriorating economic environment, people prefer risk-free instruments to riskier corporate bonds. Hence, money flows out of corporate bonds (lowering prices and hiking yields) pushing the risk premium up. You would have seen this in March 2020. The reverse is also true.
- Downgrades: When a bond gets downgraded, its risk premium goes up because you expect the bond to deliver more (a downgraded bond’s yield moved up) for the enhanced risk.
- Small differential matters: Unlike equity, the risk premium between debt instruments is not very high and changes in a graded manner (see table given earlier). A 25-basis point difference can be considered a good additional return to earn. This 0.25% additional interest translates into 3.6% additional interest income for you! To illustrate – if you invest Rs 1 lakh earning 7% in a bank FD and another Rs 1 lakh earning 7.25% in an NCD, the interest income earned is Rs 250 more in the NCD. That is, it’s 3.6% more than the Rs 7000 earned in the bank FD. So don’t underestimate the outcome of even a 0.25% differential.
- Comparison between funds: If you take mutual funds, you cannot compare the return in credit risk funds (which hold lower rated papers) versus say corporate bond funds (that hold high quality papers), without understanding that the risk premium is the price asked for undertaking the risk of default. In other words, you cannot simply go by the returns profile, without knowing the risk profile of different categories.
The final learning? Your return expectation from debt must be linked to a risk-free instrument. Debt’s risk premium is highly correlated to the credit standing and tenure of the non-government instrument. If you expect a AAA-rated bond to deliver 10% when similar tenure gilt gives under 6%, your return expectation is incorrect - unless the AAA-bond is going to be downgraded!
And if a bond does deliver 10%, then you know that the risk premium (credit risk) is certainly high. And that risk is the risk of losing capital. Never forget that.
Risk premium in equity
It is a lot more complex to understand equity risk premium or ERP for short when it comes to equity. This is because, unlike a bond, equity does not have any certainty in cash flows over a definite period. Neither your dividends nor the returns are guaranteed over any fixed period. You cannot do a simple cash flow and IRR to know your yield, like you would with debt, unless you make your own estimates.
If this is so, what cues can you use to assess ERP in order to set a reasonable return expectation?
Historical data is often taken as a cue to assessing the risk premium for equity. If your equity returns in the past were say 12% and your gilt returns averaged at 8%, then your ERP is said to be 4% (this is a simplistic explanation). This ERP is applied to the present scenario by adding it to the expected returns of the risk-free instrument to arrive at your expected return.
Unfortunately, because ERP is influenced by a multitude of factors, past data may not play out in the same manner. Similarly, depending on what time period you take, the historical data may show different results. The image below is picked from a tweet by finance guru Aswath Damodaran on factors that make the ERP a dynamic number.
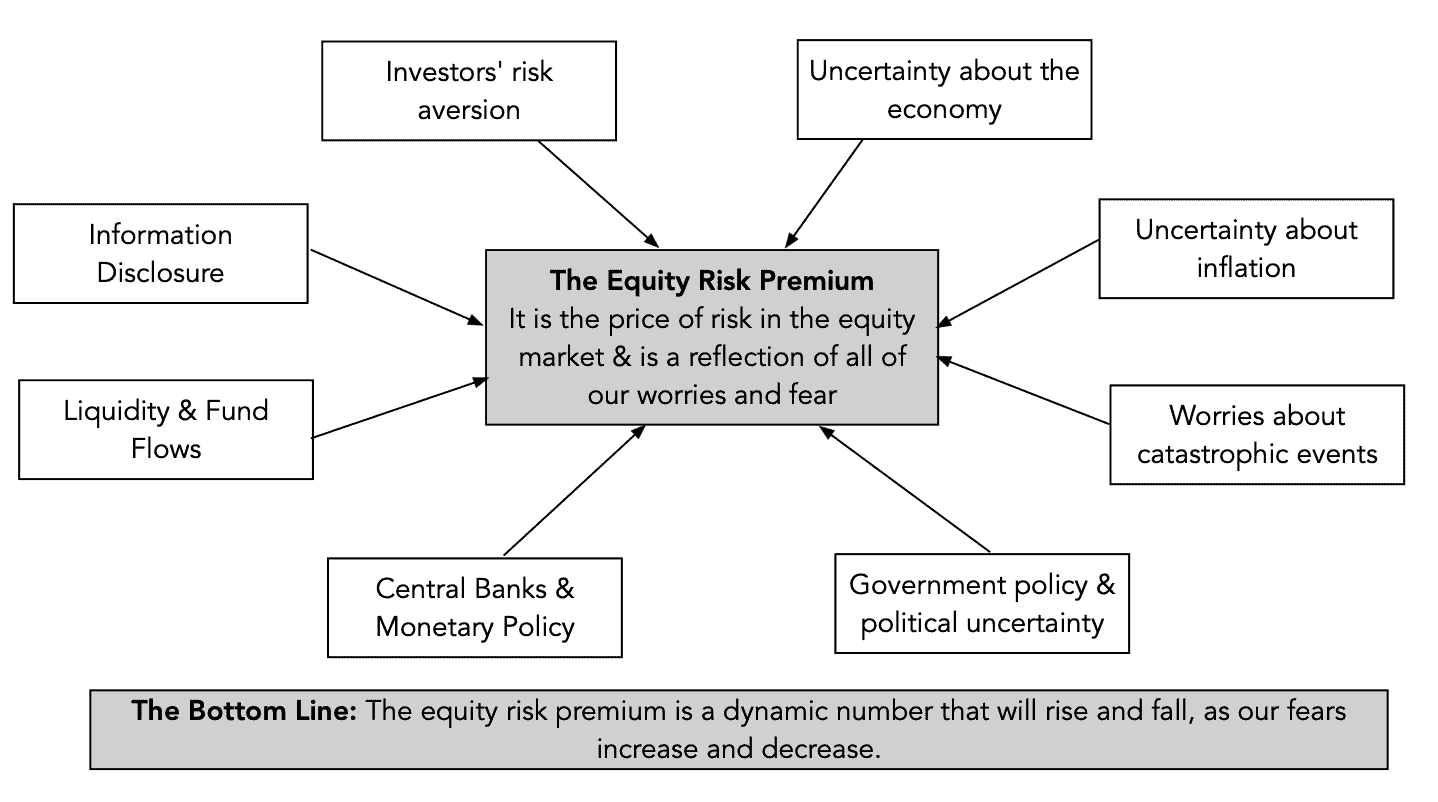
Source: Aswath Damodaran’s tweet in April 2021
What are we trying to say here? Just this - taking the historical return differential between a market index and a risk-free return may not factor in bull or bear market scenarios that you may be encountering in future, nor will it consider your own risk aversion.
It is because of this that people like Prof. Damodaran use the forward ERP. Of course, this involves estimation of many things:
- You need to calculate the expected return on stocks (using IRR) and reduce the risk-free rate of return today
- For the expected return, you need to arrive at the present value of a series of cash flows. And to do this, you will need the current price of the index/stocks, cash flows such as expected dividends or buybacks.
- But here again, to do this cash flow, you first need to estimate earnings.
- A few others find India’s payouts to be low and hence take the US ERP and add a country risk (default risk) to arrive at India’s premium.
I am not going to delve into the academic part of how to do this. If you are interested, you can check out Prof Damodaran’s blog or this RBI paper in October 2020 that has used the dividend discount model for India and calculated the ERP (this is not a regularly published data point).
Most of you won’t really have the time to undertake such calculations, nor is it necessary that you do. But you do need to understand the concept of ERP for the following reasons:
ERP is necessary for you to base your expected returns from equity. And that in turn is necessary to work towards any kind of goal. For example, if you had seen equity deliver 20% between 2005-10 and therefore pegged that as your return expectation for the next 5 years, you would have been rudely shaken with an 8.5% return! Your goals would have been thrown off track had you invested with such an estimation.

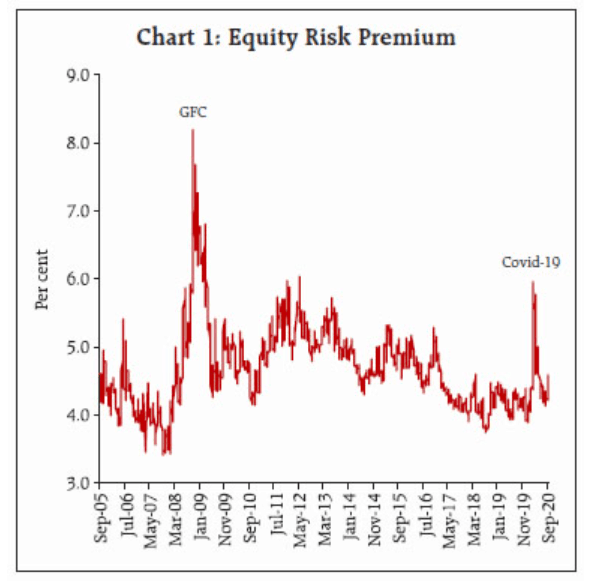
ERP helps in equity allocation decisions. Yes! It’s not just P/E or P/BV but ERP too, that can tell you whether stocks are overpriced or undervalued. Post market crashes like 2008 or even March 2020, the ERP, according to the RBI paper went up (see image below). That means when risk aversion is high, investors seek depressed prices to invest in the same asset now, for it to deliver. Conversely, when markets have rallied, ERP reduces simply because the growth potential reduces.
ERP and your return expectation
The ERP will tell you that a corrective market, when you are most risk averse, is the best time to invest to earn potentially high returns. Yes, you already know this intuitively. But how do you set return expectations without getting into complex ERP calculations?
#1 Market peak
When there is a prolonged market rally, tone down your return expectations on investments made at that point. Do not expect the past returns to repeat. The graph above (from RBI) gives you a good estimate of how ERPs have moved. When markets have rallied swiftly, your ERP and therefore your return expectation should reduce. By how much? As close to risk-free return as possible. That way, your chance of being caught off guard will be low.
#2 Market correction
When the market is undergoing a correction, your return expectation (or ERP) can be high. How high? Let’s say you take the best nominal GDP growth in the last 5-7 years. Why do I say that? The nominal GDP growth (real GDP growth plus inflation) is a reflection of growth in the economy and the listed companies should at least grow at that rate, if not higher. For example, the nominal GDP in the last 5 years expanded 7.3% annualized. The Nifty 50 grew 8.5% over the same time. While you may not know what the GDP estimates are, use the worst (over the past 5-7 years) when markets are at a peak and the best (when markets are low) to build your return expectation for the next few years. This is far from calculating ERP in a quantitative manner but is still better than basing expectations at your own whim!
#3 Look to bond market
If the above is still difficult, look at the more quantifiable bond market. If stock markets are in top gear but bond market credit risk premium is going up, it may be a sign of economic stress. Be prepared to tone down your return expectation on equity as well.
#4 Don’t overrate small-cap premium
The last point is on the excess premium that you give for the risk you take in midcaps and small-cap bets. This is not wrong, but you need to understand the premium you are affording. Typically, small-cap premium stems from a stock being either under researched or having dearth of knowledge about it in the market. But oftentimes, you (or analysts) may be affording a premium for illiquidity. Illiquidity is not a proxy for beta.
Besides, there are other reasons why you may have to be wary of the premium in smallcaps.
One, every time a correction happens, there is a higher chance of small and midcap success stories moving into oblivion. So, your high return expectation on certain stocks that were stars earlier, may not transpire at all.
Two, as the graph below will tell you, the small-cap index struggled to deliver in the last 3 years had you invested anytime from 2016 (rolling 3-year returns from 2019). The Nifty 50 had a far higher run-up. So, your static small-cap premium does not consider such cycles and your return expectation versus actual returns may be disappointing.
Since it is hard to decipher when small-cap cycles may be peaking or bottoming, the easier thing is to tone down the return expectation in this market cap segment. This will ensure you don’t go completely off mark in your estimated return for goal-based portfolios. Anything you get over your more sedate expectation will be a bonus.
Overall, in equity the message is simple:
- you cannot have a return expectation without a basis. Have a reference point of risk-free return and look at the market phase you are in, to build the risk premium.
- You certainly cannot have a return expectation based on high past returns. At such times, you should tone down than hike your return expectations for the next 5 years. The reverse is true in a corrective market phase.
High rally period – Risk free rate + Low expected ERP
Market correction – Risk free rate + High expected ERP.
Finally, if your question is if we can do these calculations for you - we are trying to build a tool for taking equity allocation (and cash) calls, where ERP will hopefully be one among the many metrics used. Meanwhile, you might want to check out on this country-wise ERP (including India’s) from Prof. Damodaran’s library: Country-wise Default Spreads and Risk Premiums You might also want to check our (slightly dated) article on whether you have the right return expectations in mutual funds.
