You would have heard fund managers talk about following a top-down and bottom-up approach. What are they? How do you use them to filter your stocks and when to use what? This article will try to touch upon some aspects of these approaches to investing, with screeners (from our own Stock Screener tool) that will illustrate and help you understand how to approach these strategies.
This article will suit beginners and intermediate level learners of stock markets.
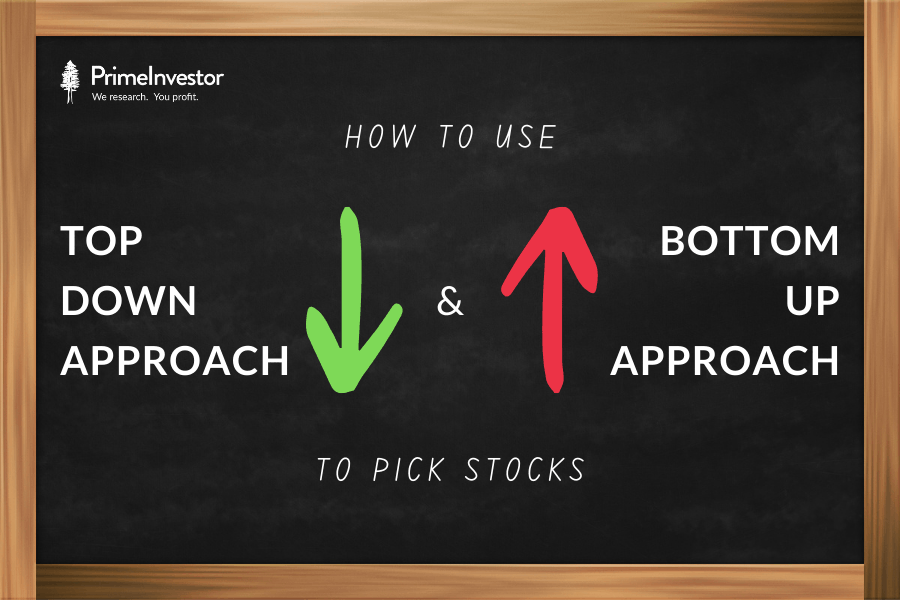
What is top-down and bottom-up
In a top-down approach, the big picture comes first. This approach places emphasis on economic, industry and market cycles. Bottom-up investing, on the other hand, focuses on the analysis of individual stocks and gives less importance to economic, market and industry cycles, although these are not entirely ignored at all times.
In a top-down approach, it is believed that some sectors do well in certain economic cycles. In a booming economy for example, banks can be expected to do well. In a low interest rate scenario, high capex industries are expected to grow faster. So, the approach helps narrow down sectors that are likely to benefit from a given economic cycle.
Some of the macro-economic variables that help filter sectors are local and global GDP growth, currency movements, inflation, interest rates, commodity price trends (and so on) and the sensitivity of different sectors to these factors. For example, Indian companies in export sectors such as engineering exports and IT services tend to do well when the global economy does well while financial & discretionary consumption do well when the domestic economy does well.
The bottom-up approach, on the other hand, assumes that individual companies can do well even when their industry is not performing well or will gain the most when the industry or sector cycle turns. Making decisions based on this approach entails a thorough analysis of the company chosen. Management quality and capital efficiency are the key factors in this kind of analysis. For example, if we take sectors like cement, steel or real estate, there are companies that went belly up after the previous investment cycle peak while there were also those like JSW Steel or Shree Cement or Godrej Properties that emerged as outliers in their space, defying the downfall trend.

How they work
When there is an indication that a sector is going to perform well in future, top-down approach can be put to best use. This is because when there is a high chance of a sector doing well, there is a good chance that a majority of the companies in the space will do well. So, your chances of picking the wrong stock are reduced. Case in point now can be the IT sector. Of-course, such a sector will still have some stocks at the bottom because there may be a reason why the market shuns those stocks. But even then, when you spread your allocation across stocks, such misses won’t entirely hurt the portfolio.
The table shows returns of IT index and market-cap segments in IT in the last 1 Year. While the data shows that mid and small IT outperformed, even if you had some allocation to the relatively subdued large cap IT, you would still have beaten the Nifty 50.
Bottom-up approach is an approach for all seasons. Digging deeper with this strategy can unearth multi-baggers too if your research is thorough! This approach can work well to earn superior returns even when the broader market is not doing well.
To illustrate this, assume that you had taken the Top 50 Nifty companies at the beginning of this decade to pick and create your retirement portfolio. Would you have beaten the Index or generated enough returns as anticipated?
Let’s look into what happened to the Top 50 companies during the last decade. If we take a 11-year period between September 2010 (we took this period to match the Nifty’s recovery from the global financial crisis) and August 2021, the Index delivered 9.67% compounded returns. But, this is not the kind of tame return an equity investor expects from the equity market. While 15 companies went out of Nifty (which essentially means they did not do well), 14 companies delivered single digit returns and three went into losses! Effectively, in the 50-stock index that you started out with, 31 stocks failed (of the stock that exited the Nifty only 1 managed to deliver higher than even Nifty’s sedate returns).
But a few (12 stocks) bucked the trend. Only if you had picked those winners (and also avoided the poor returning ones) you would have made meaningful returns. This suggests that bottom-up stock picking is extremely hard but can help outperform significantly.

How to use these approaches?
In top-down approach, since the idea is to first pick a sector for investment and then choose companies based on the allocation plan, there are two parts to it:
- One is to understand the changing dynamics that favour a sector (popularly called tailwinds) and other is selecting the stocks to invest. To understand the tailwinds, you can listen to management comments of industry leaders, read annual reports, look for industry publications (like NASSCOM for IT, World Steel Association for Steel), conference call of individual companies, and even the stock market sentiment itself towards a sector
- The second part is to narrow down the universe of stocks in the chosen sector. To select stocks belonging to a sector, you can use our stock screener to get the list of stocks based on various financial parameters and arrive at a filtered list of stocks for further analysis.
Below is a list of stocks selected from the IT sector using few among the many metrics in our stock screener. This is an illustration and should not be construed as our recommendations.
Let us elaborate on how we arrived at the above list:
- Initially there were 98 stocks in the “IT – Software” Sector
- Using our “premium screen – Steady cash flow positive”, the list narrows down to just 56 stocks. In a sector like IT-Services, it is fine (in our view) to eliminate companies that are not steadily free cash flow positive.
- We then applied a “market cap filter” to weed out smaller companies. Keeping the lower end of market Cap filter at Rs. 5,000 crore, the list narrows down to 23 stocks.
- After that, we added 3 growth filters (3-year growth), 3 quality filters (RoE, RoCE, Debt/Equity ratio) and 2 valuation filters to get our final list.
While growth has been muted for companies in recent times, you can up your focus on quality at such times. So, we took 15% as minimum RoE and RoCE while Debt/Equity was kept to less than 0.5.
- Now, the list narrows down to 19 stocks (if you are interested in small caps, you can keep the lower market cap range at Rs. 1,000 crore. This will expand the list to 25 stocks to do further analysis)
From this narrowed down list, you can further look at the growth and growth prospects besides valuation and a combination of large and midcap as well, since you are taking a call across the sector.
Tip: Use our Stock ranking tool to know where your stock stands on individual metrics of growth, quality and valuation.
When it comes to the bottom-up approach, apart from crunching numbers you will need to look at qualitative factors such as competitive advantage (referred to as “economic moat”), management quality and capital efficiency. It also requires a deeper understanding of valuations, unlike the top-down approach where your stock may move up despite high valuation. A structured approach to this would be to first apply quantitative growth and quality parameters and then do rigorous research on qualitative factors on a narrowed set of companies. Remember, quality reflects in numbers as well.
Below is a list of quality growth stocks selected using our stock screener. This is for illustrative purposes only and not a recommendation on the stocks.
Let us elaborate on how we arrived at the above list:
- We took the entire universe of 1758 NSE listed stocks in the screener.
- Next we have applied 2 growth filters (3-year sales, PAT growth), 3 quality filters (3-year average RoE, RoCE , latest Debt/Equity), 3 valuation filters (PE, P/BV and M Cap to Sales) and one ownership filter (promoter pledge).
- We kept a lowered threshold at 5% growth for sales and PAT as companies have gone through a tough phase towards the end of FY20 and much of FY21. But we did not compromise on quality. We chose the lower band of RoE and RoCE at 15%
- We capped the PE ratio at 50 and market cap to sales ratio at 10 to get stocks at reasonable valuations while we chose only stocks with market cap of over Rs.5,000 crore
- From the entire list of NSE listed companies, the shortlist narrows down to 26 companies meeting these criteria, thus making it a more compact list to analyze further.
- If you are interested in small caps, you can keep the lower market cap range at Rs. 1,000 crore. The list would expand to 58 stocks.
- Promoter share pledge is an important qualitative factor that has been considered and companies with pledge above 10% were eliminated.
Tip: Here is also a link to the video on how you can select growth stocks using our stock screener & stock ranking tool.
The next step is to do a more detailed analysis of each of these companies to decide which companies to invest in and at what price. The qualitative sides include the following:
- understanding the business of the company
- Its competitive advantage
- Growth prospects
- Corporate governance practices
- Shareholder friendliness and past capital allocation decisions
An Independent valuation exercise can be attempted to assess the fair price. Otherwise, you can choose to pay the market price (even though it is high) in lieu of quality and wait for returns over time. You can read our article - Reading the Annual Report - to get insights on what qualitative and quantitative factors to look for when analyzing companies

How to benefit from these approaches?
De-jargonizer
Going over-weight and under-weight: When you increase the proportion of holding in a sector higher than market benchmarks such as the Nifty, you are said to go overweight on a sector. Your ideas here is to own more of those stocks from those sectors that you expect to outperform. The reverse is called underweight. Here, you wish to reduce allocation to sectors that you expect will relatively perform less.
Since the top-down approach is a sector call, one can benefit by building higher allocation to sectors that are likely to perform well.
In an earlier table we say the IT sector outperformed the Nifty 50. While the IT sector’s weight in the Nifty 50 was 17.5%, any investor with a higher allocation (say 25 or 30%) to IT would have out-performed the Nifty 50. This can be done by using additional capital or by reducing allocation to sectors that are expected to perform poorly.
For example, the Nifty 50 currently has 37% weight to the financial sector. If you expect that sector to perform poorly in future, you can reduce the allocation (going “under-weight”) to that sector and still out-perform the market returns.
The top-down approach can be used market-cap-segment-wise as well, by rejigging allocation to large, mid and small-cap stocks, depending on where the market’s sentiment lies at that point in time. This is typically how fund managers of mutual funds play sectors.
A bottom-up approach, on the other hand, can be highly rewarding in the long term but may disappoint in the short term. In other words, it can generate multi-baggers if applied well (Read our article on multibaggers to understand various factors that lead to it).
The bottom-up approach lays significant emphasis on “time” rather than “timing” (which is a facet of top-down approach). The underlying philosophy is that longer the time spent in a well-researched quality stock, the more rewarding it will be.
To illustrate this, we will just look at how the 3 outliers in metal and realty (from sectors that faced troubles) mentioned in the beginning of the article performed even when the sector itself was underperforming.
Few other outliers include Eicher Motors in the auto sector, Bajaj Finance in NBFC, Titan in consumer durables and Divis Lab in pharmaceuticals.
Snippet: A 15% compounded annual returns means capital doubling every 5 Years or generating 4X returns in 10 years. A 25% compounded annual returns translates in to 9X returns in 10 Years with capital doubling every 3.3 years.
Yes, the above is easier said in hindsight – which is why bottom-up approach is not easy. To sum up, top-down and bottom-up are the two broad investing approaches. One can use a combination of both to create stock or mutual fund portfolios and beat the market. The top-down approach helps to go “overweight” or “under-weight” on a sector in the portfolio and reduces hits and misses in a portfolio. The bottom-up approach goes to the very core of fundamental stock investing and can richly reward or hurt!
P.S: Do read our article on how to build a stock portfolio to know the other guidelines to building a winning portfolio.