When it comes to mutual fund returns, two things are true for most mutual fund investors:
- It is the most important thing for them
- It is among the least understood set of concepts
An advisor may talk about all the nuances of mutual fund investments to an investor – risk mitigation, balancing, diversification, down-side protection etc – but at the end of the day, the person would only care about how much he/she would end up making.
And yet, when it comes to reading and understanding returns, they could make elementary mistakes. For example, once when I recommended an investor invest in a scheme for 5 years for optimal benefit, he said he would invest in it for a year, because “the fund has better 1-year return than 5-year return” – obviously going by the most recent numbers.
Such fallacies are commonplace among investors, and truth be told, it’s not all their fault. The industry of financial services thrives on the innumeracy of their customers and makes the most of it with misrepresentations and obfuscations – leading to a sustained perpetuation of the wrong notions.
Well, this article is an attempt to explain the basic terminologies in simple terms. And it assumes no more than a middle-school arithmetic knowledge from its readers. Although the context of this article is mutual funds, the concepts themselves are applicable across investment products.
Let’s start with the simplest form of returns – the absolute return.
Absolute return
(Also known as point-to-point return)
This is the most straightforward form of representing what you got out of an investment – it is so simple that it may as well be just called ‘return’ – as in, what returned to you (in the form of profit or loss) from an investment that you made.
This is also called point-to-point returns, since it measures the returns from one point in time to another point in time.
What it is
It is the absolute profit (or loss) made from an investment, regardless of the amount of time period of the investment. It is arrived at by using this formula:
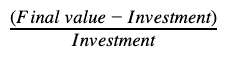
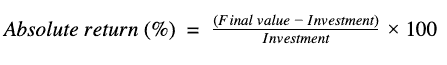
This formula would generally yield a fractional number, and for ease of understanding, it is expressed as a percentage by multiplying the above number by 100.
So, the absolute return percentage from an investment would be:
Example
Let’s quickly look at an example. Suppose you invested Rs 1 lakh in a fund, and a few years later (does not matter how many years you invested), you redeem it, and the redemption value is Rs 1.35 lakhs.
The absolute returns from this investment would be:
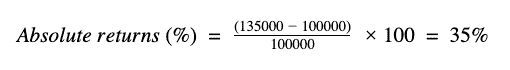
So, you made an absolute return of 35% from this investment.
This also works if, unfortunately, you made a loss in your investment. Suppose your redemption value was not Rs 1.35 lakhs, and it was Rs 80,000 – meaning you lost Rs 20,000 from your investment. The absolute returns would be:
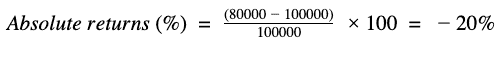
Easy, right? Now let’s see where this figure is useful and where it is not.
How it should and should not be used
The absolute returns percentage is extremely useful as a vanity number. And not much else. It is typically used in dinner parties, especially while talking about returns from real estate investments – as in, “we bought this property long back for Rs 1 lakh and now it is going for Rs 1 crore in the market – 100 times! A 10,000% return”.
As you can see, there is no mention of when it was bought or the number of years that have passed. Absolute returns don’t talk about the time frame of investment – just the total profit (or loss) that was made.
Absolute returns are also a favorite tool of financial sales people. In their hands, it usually takes the form of ‘doubling’ or ‘tripling’ your investment – essentially communicating an absolute return of 100% or 200% – huge numbers, if only you ignore how long it takes to do so.
So, is there a valid use for absolute returns? Surprisingly, after all the negatives above, yes there is! Absolute returns can be used for any investment that is made for less than a year. There are better ways to look at investment returns made for more than a year (we’ll explain in the next section), but when you invest for 3 months or 6 months or 9 months, it is best to consider the absolute return that you make. Looking at what’s called annualized return would be wrong in this context since it would be an extrapolation of your short-term returns.
And as you can imagine, when it comes to financial sales people, they always want to use the bigger number – use annual return when it comes to short-term investments, and absolute return for longer term investments. As an investor, and from a mathematical perspective, the right thing to do is just the opposite.
Having seen the most basic of return types, let’s move on to a slightly more advanced, and much more useful return metric – Annual returns.
Annual returns
(also known as CAGR, compound returns, compounded annual returns, Annualized returns)
Mutual fund investments are usually made for the long-term. And by long-term I mean a time period lasting several years. In such a situation, it is more useful to look at how much a fund returned (or “performed”) on an annual basis rather than on an absolute basis.
There are two important reasons why this is so:
- Time matters: If we want to know whether an investment return is ‘good’ or ‘bad’ we need to know how long it took for the return to materialize. Many other financial metrics, especially inflation, are expressed in annual terms, and for us to benchmark our returns with these other metrics, we should use something that is correlated with time as well.
- Making things comparable: We are faced with plenty of investment choices, and not just in mutual funds. To be able to make a decision, we need to be able to compare these instruments. And for that, we need a metric that we can use for comparison. The earlier metric that we saw – the absolute returns – is absolutely useless in this regard. Why? Because you could say your instrument returned 40% and I could say mine returned 60%. But yours could have happened over 2 years, and mine over 10. Unless we express these numbers annually, we cannot compare them fairly.
What are annual returns
Simply put, annual returns are absolute returns annualized. What does that mean? It means expressing a return in such a way that the return builds on itself (compounds) every year. That is why these are also called compounded annual returns or compounded annual growth rate (CAGR – although technically, it need not always be growth since CAGR can be negative as well).
The formula for calculating annual returns on an investment is to simply take the return fraction and raise it to the power of (1/n) where n is the number of years invested (and then subtract 1 to remove the principal component). You don’t need to “understand” this formula – just knowing that there is one is enough – you can always look it up!
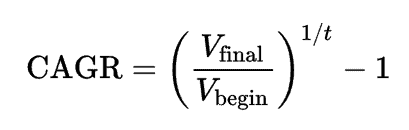
This is just the formula. Things will get a lot clearer when we look at an example.
Example
Let’s first understand the arithmetic aspect of compounding with a simple non-mutual-fund example. Suppose you lend me Rs 1 lakh and I offer you 10% interest on it for a year. At the end of the year, I would give your Rs 1.1 lakh (Rs 1 lakh + 10% of Rs 1 lakh = Rs 1,10,000). Now, if you lend me back the Rs 1.1 lakh and I offer you 10% interest again, at the end of the second year, you make Rs 1.21 lakh (Rs 1.1 lakh + 10% of Rs 1.1 lakh = Rs 1,21,000). Money building on itself in this manner is what is called compounding.
However, if you give me money for 5 years, and I tell you I will give you double the money after 5 years – the total returns (absolute return) you would make on your investment – over 5 years, mind you – would be 100%.
Now, what would I tell you if you ask me what the “annual returns” are? Should I say that it is 20% (100 divided by 5)? Well, that would be what’s called the ‘simple returns’. There’s nothing wrong with specifying that, but in the world of finances, the traditional way is to represent the annual returns in the form of compounded values.
(Why is that so? Because invested money grows on itself – that is a fundamental principle of investment. If you start a business with Rs 1 lakh and you make a profit of Rs 20,000 in a year, you deploy Rs 1.2 lakh in the business the second year so you can make a profit of Rs 24,000 in the second year, and so on. The most accurate way of capturing this growth is by using compounding)
So, let’s get back to our scenario. The annual returns on the amount lent to me (Rs 1 lakh set to double in 5 years – absolute return of 100%) would be, applying the formula above:
CAGR = (Rs 2 lakh/Rs 1 lakh ) to the power of (1 over 5), minus 1.
And that would be equal to 14.87%
What this means is that the money compounded every year at the rate of 14.87%.
Let’s verify that:
Rs 1 lakh @ 14.87% growth at the end of one year would be 1,14,870.
Now, since we are compounding, we apply 14.87% on Rs 1,14,870 for the second year. So, at the end of second year, the amount would be Rs 1,31, 951. Going forward, the same calculation would give us Rs 1,51,572 at the end of 3rd year, Rs 1,74,111 after 4 years, and Rs 2,00,001 at the end of the fifth year. Voila! Double in five years!
So, this is how CAGR gets “calculated” from an absolute return. CAGR can be used to represent returns in the past (how much a fund gave in the last five years), and for the future (how much will a deposit – not a fund – will give in the next x years).
(Please note that some bank deposits offer quarterly or half-yearly compounding of interest as well – I am not covering those scenarios here since my focus is on mutual fund returns, and also because in most cases that’s just a marketing gimmick.
Let’s look at the right and wrong use cases of CAGR now.
How it should and should not be used
Annual returns are a versatile metric – it can be used in many useful ways. However, there are also situations where it would simply be wrong to use them to represent returns. Let’s look at them in turn.
The best use case for annual returns would be to compare two similar investment instruments. If you go to one bank and they offer you 8% interest for a 3-year term deposit, and you to another and they offer you 8.5% for the same term, it would be fair to compare these numbers. Similarly, when you look at past performances of mutual funds, if you look at two similar funds and their track record over similar time frames, annual returns would be the right metric to use.
But, you should be aware that CAGR often ‘masks’ the underlying movement of the value of the investment. A stock market investment, for example, would move up and down over the period of time – the CAGR will make it appear as if the stock gave a uniform x% of return over the number of years.
Here are some more things you should keep in mind:
- You should not use annual returns for any period less than one year. We saw this in the earlier section as well, and it bears repeating. If someone tells you a scheme returned an annualized 8% in the last 6 months, it means it returned 4% in the last six months. And nobody knows what will happen in the next six months. So, annual returns should not be used in this context.
- You should not compare returns over different periods in time. If a fund returned x% annually over a 3-year period and another fund returned y% over a 1-year period, x and y are not comparable.
- When it comes to mutual funds, past returns are always expressed as annual returns. However, this says NOTHING about what the fund will return in future. As simple as this sounds, I just want to state it for the record.
- Annual returns cannot and should not be used for SIPs. More on that in the next section.
- Annual returns in this form cannot be used to calculate how much your investment returned when your investment involves multiple transactions.
When you look at mutual fund factsheets or website displays, you will find a lot of performance numbers. Most of them show absolute returns if the period is less than 1 year and annual returns for periods greater than 1 year. Understanding and internalizing the concept of compounded annual returns is very important for interpreting those numbers correctly.
What about ‘yield’?
Many bank deposit advertisements carry a figure called ‘yield’ – which is typically a higher number than the annual returns number. As I mentioned earlier, people who are selling products to you love showing you bigger numbers!
Yield, in this context and as it is used by such people, always refers to the simple interest representation of the annual returns. As we saw in the example above, while the annual returns for the investment that doubled in 5 years was 14.87%, the simple interest was 20%! Guess which one the banker would like to showcase to you!
Also, in some cases where there is a tax saving involved, the potential tax savings are also added to the ‘return’ of the investment to show a really big number! What you save on taxes is none of the financial institution’s business and such numbers are just plain wrong.
As they say, buyer beware – when you see two numbers in an ad like this, the lower one is likely to be the real number.
Internal rate of return
We first looked at a rate of return that is not of much use, and then went to something that was of limited use. Now let’s look at a rate of return that is useful in a wide variety of situations.
Remember when we said that annual returns or the CAGR formula cannot be used to calculate SIP returns of your investments? Well, this rate of return addresses that.
The internal rate of return, also known as IRR, helps us calculate returns when there are multiple transactions. Technically speaking, IRR can be used when there are equal value investment transactions that are spaced over a period of time. Like investments made every month. Like SIP.
What is IRR
If you look at the formula for annual returns, you will see that there is an initial value, a final value, and the number of years. Implicit in this formula is the fact that this investment was made at one time and valued at another time – with many intervening discrete periods of time (years). But what if we make several little investments during the course of this investment period? Like, as I said, in an SIP. The annual returns formula would obviously not work to calculate the returns in this scenario
The right way to calculate returns here would be to calculate returns of individual investments over just the period of time it was invested, and then aggregate them to calculate the overall returns.
Now, that would simply be too tedious. So, smart people came up with a way to do the same thing using what is called the ‘net present value’ (NPV) calculation. In general, NPV is a method of calculating the present value of a series of future money flows given a rate of return (or a rate of inflation, for that matter).
This formula can be inverted to find out the rate of return given the values of a series of money flows (investments, in this case), a final value (current value of investments, say), and a period of time (over which these events happen). Technically speaking, IRR is calculated by taking the current value of investments and the series of investments made as a full series of cash flows, the time periods when these happened, and setting the net present value to zero. From these figures the rate of return can be calculated by inverting the following formula:
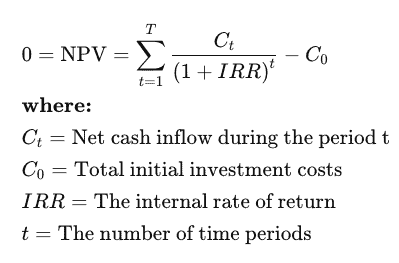
(From Investopedia)
OK, let me admit – this is not easy stuff. But don’t worry. It is important to have an understanding of the concept and the basic theory behind it. You will NEVER be required to use this formula by hand – this is what God created Excel (and Google Sheets) for. But knowing a bit of theory never hurts.
An even better way – XIRR
Before we get to an example, let’s look at a close cousin of IRR, and that is Extended IRR or XIRR. As we saw above, the IRR formula assumes cash flows coming in even intervals of time (monthly, for example). But life is seldom so conveniently even. We invest when we have money, we invest when we think it’s a good time etc. So, to calculate the rate of returns in such situations, a metric called XIRR is used.
The formula for calculating this is non-trivial – it uses an advanced mathematical approximation method from numerical analysis to do so. Thankfully, again, this is available in Excel so that anyone can use it in a matter of seconds.
Now, let’s look at a couple of examples.
Example
Let’s take a look at an example.
Our goal is to calculate the internal rate of return for situations that involve even periods of time and when they don’t involve even periods of time.
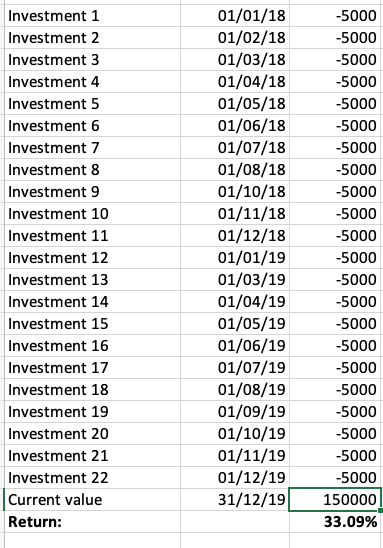
Suppose we invest Rs 5,000 in a fund for 24 months. So, at the end of 24 months, we would have invested a total of Rs 1.2 lakhs (5,000 x 24) into the fund. Now, let’s suppose the value of the investment at the end of 24 months is Rs 1.5 lakh.
Now, since we are making the investments over a period of time (and not at a single point in time), we cannot use the CAGR formula here. And, because we make the investments in uniform amounts and periods (monthly), we can use the IRR formula here and calculate the returns from this SIP.
The typical way to do this, as I indicated earlier, would be to use Excel to do so. There is a formula called, well, IRR in excel that would compute it for us. To use it, we represent the investment values as negative numbers and the current value as a positive number. And since we want an annualized number, we have to put in the numbers as annual investments as opposed to monthly investments (we’ll remedy that shortly). Please see the image below:
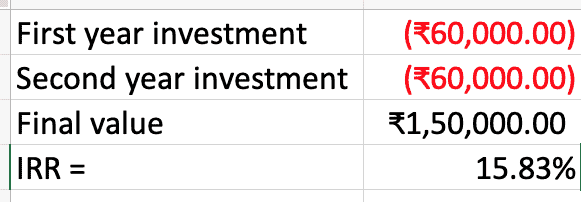
(The formula used is = IRR(cashflows))
Now, if you look at this, you will see that what is missing here are the dates of our investments. And rightly so – remember, IRR assumes uniform time periods – so it does not care about the dates. And if you need annual returns, you need to provide it annual cash flows.
SIP investments don’t follow annual patterns and we may miss a payment or two as well (not uniform cash flows). In such situations, we would need to use the XIRR method to calculate the annual returns. See the example below. Here, investments are skipped in September 2018 and February 2019.
The Excel formula used is XIRR(investment_values, dates). As you can see, this formula takes into account the dates of investments.
What if you have outflows (redemptions) during this period? Simple – just add the date and the amount of redemption as a positive number to the list and use the same formula. Excel will automatically take that into account and produce the right returns figure.
How it should and should not be used
IRR, and more specifically, XIRR can be used in wide variety of situations:
- Calculate returns of a fund (yes, you can use this instead of CAGR formula and you would get the same answer)
- Calculate returns of your SIP investments
- Calculate returns of your irregular investments (XIRR only)
Apart from the implicit complexity of the formula used (can’t be done by hand or a calculator – you need Excel), there is really no downside to computing and using XIRR to understand investment returns. It is, hands down, the best method to represent and compare returns from one’s investment, especially over a long period of time. As with annual returns, however, IRR is not to be used in the context of investment returns to show or understand returns from an investment period of less than one year. For that, absolute returns continue to be the best method.
A note about portfolio returns
We rarely invest in a single fund – our portfolios are often made of many funds – sometimes grouped together in portfolios. How do we calculate the aggregate returns from a whole portfolio? Can we use the XIRR method for that?
Definitely! Portfolio XIRR returns are the best way to understand and manage your overall gains, especially in the context of goal-oriented portfolios. To use XIRR in this context, you do not need to find out the XIRR of individual funds in the portfolio. Rather, you can gather all the inflows (and outflows) into (and out of) the portfolio and apply the XIRR formula on them along with the transaction dates. The resultant XIRR would be the annual returns that you obtained from the portfolio as a whole.
Rolling returns
Now that we can calculate correct returns for investments less than one year, more than one year, with irregular cash flows, and for our entire portfolio, what more can there be? There’s rolling returns. What are these rolling returns, and why should we understand them?
Let me put it this way – rolling returns are a secret weapon that will help you make superior investment decisions about mutual funds. You won’t find them in many places (and PrimeInvestor is fixing that issue soon) and they are very difficult to calculate for an regular investor (not because it has a complex formula, but because it requires a lot of data). But once you understand what it is and how useful it can be, you will be convinced that it is among the best mutual funds performance metrics to employ.
Why should we understand rolling returns
The thing we have to realize about all the return types we saw thus far is that they are about the performance of investments made in the past during specific periods of time. These metrics are useful to understand how our investments did in the market and what they returned as profits.
However, if we are trying to make a decision about where to invest now, by looking at the past returns of different mutual funds, then, such time-specific returns will not present the full picture.
Why? For the simple reason that the numbers we would be looking at would be ‘biased’ by the time window that we are looking at. For example, if today’s date is March 30, 2021, and we are looking at the 3 year CAGR of a fund, then we are looking at the period between March 30, 2018 and March 30, 2021. As in, this is a ‘point-in-time’ number. Can we make a decision based on just this one data point? Will that be a sound decision? Likely not. Our investment date could be similar to March 30, 2018 or it could not be. As it is, we are looking at the past to make a call about the future. Should we not look at more dates to make a more informed decision?
That is exactly the promise of rolling returns. It looks at returns made at various points in time in the past and provides a more balanced view of the performance of a fund. Thus, it enables us to make more informed decisions about our investment choices.
What are rolling returns?
Rolling returns are point-to-point returns calculated on, typically, a daily basis for a specified period over another longer period of time.
Let’s untangle that. First, let’s understand that rolling returns – as the name suggests – is not a single value. It is a series of values (along with dates). The individual return values themselves are calculated using the same formulas that we saw in the first two sections – absolute returns if the specified period is less than a year, and annualized returns for longer periods.
In the line above, we had two ‘specified’ periods. Let’s take an example. We could calculate one-year rolling returns for a fund every day over a period of 5 years. What this means is that we calculate the one-year return for EVERY single business day for 5 years and present the results as a series.
If our period of 5 years is, say, between Jan 1, 2015 and Jan 1, 2020, then we would compute the one-year return for the period between Jan 1, 2015 to Jan 1, 2016, and then between Jan 2, 2015 to Jan 2, 2016, and so on until we get to Jan 1 2019 to Jan 1 2020. We would have about 1250 data points (approximately, since a year has about 250 business days).
From this data, we can get all kinds of information – the average rolling returns, minimum, maximum, median, standard deviation, and all such numbers that are a statistician’s or an analyst’s delight.
Let’s take the simple case of an average – when we average the returns obtained in this manner, we would have a much better understanding of how the fund performed in the past – we have 1250 data points as opposed to 1! This would tell us, not definitively, but with higher confidence as to what our future one-year returns are likely to be from this fund. And because markets go through ups and downs, rolling returns would tell us how the fund performed through both good and bad periods. It would be hard to understand this using the returns of just one period.
Example
Let’s take a look at a real-life example. Let’s consider one of the oldest funds in India – the HDFC Flexicap fund (previously known as HDFC Equity fund). I’ll skip the details of the actual calculation since they are exactly the same as in the first two sections.
Let’s take a sample period of a few days in the recent history of this fund, and look at its various rolling returns:
What you see above is various point-to-point returns data for this fund for EACH of the date on the right. So, you can see, as of Jan 10, 2018, for a 1-year period (starting Jan 10, 2017), the fund returned 26.23% (handsome returns indeed!). That’s what you would have made in 1 year IF you had invested on Jan 10, 2017. But if you had waited a few months and invested in, say, April 2, 2017, your 1-year return would have been just 7.48%. Still not bad for 1 year, but nowhere as good as 26%!
That’s the value of rolling returns – it allows you to see the past performance of a fund for different time periods for various dates. And that means, you get a powerful fund evaluation tool that’s better than just using point-to-point returns.
How it should and should not be used
As we saw in the example above, rolling returns are to be used for analysing fund performance. They have nothing to do with your particular investment or your portfolio. So, you cannot use rolling returns to analyze your portfolio performance.
But for analyzing mutual funds – comparing their performances with benchmarks or with other funds of their type – rolling returns can be an invaluable tool. It can lower the impact of market timing and help us get a better gauge of the quality of a fund’s portfolio management capabilities.
They are not easy to come by as it requires a lot of data crunching. PrimeInvestor uses rolling returns, and many statistical values derived from rolling returns to analyze fund performances and make recommendatory decisions for our customers. And for regular investors, it’s an important concept to understand, and a useful tool for analysis. (Update: Here is a tool that we have developed to find out rolling returns of funds)
Summary
Understanding various performance metrics used to analyze mutual funds and our investments in mutual funds is vital for any investor. We all care about returns, and we need to spend a proportionate amount of time in understanding the underlying concepts of how returns are shown, calculated and used. It will help us
- Understand our own investments and how they did
- Analyse how various funds performed in the past
- Help us make informed decisions about fund selection
- Help us see through various marketing claims about returns, and
- Become a better do-it-yourself investor who can make and manage investments with confidence!
You can read more about these concepts in Investopedia and grow your understanding. However, the best way to learn further would be to look at some mutual fund returns and your portfolio returns and try to interpret and understand them better.
Now that you know what these returns mean, here are more articles that will guide you with an even better understanding: