If you are new to mutual fund investing, it takes a while before you can come to terms with the multitude of terms used to showcase mutual fund returns. There is, for example, absolute returns, annualized returns, CAGR, IRR and so on. And to top it, folks like us keep talking to you about mutual fund rolling returns and chide you for looking at trailing returns (or point-to-point returns) 😊
This article was originally published on June 20, 2021 and is being republished for the benefit of new Prime members. Illustrations used will be dated but remain very relevant to simply explain the concepts and tools. For a more comprehensive tool with an array of performance, portfolio and expense metrics, please use our MF SCREENER TOOL.

If you are new to mutual fund investing, we would urge you to read our article on the basics of mutual fund returns, including rolling returns.
In this article, we’ll go the next step and focus on how you can use rolling returns more effectively for your DIY research, now that you have 2 tools from us on this. For those of you who are not aware, we have the following rolling returns tools:
- Rolling returns calculator – a visual representation of a fund’s rolling returns along with some key metrics derived from these returns. You can choose anywhere between 6 months to 10-year returns rolled daily to see how a fund is performing. It also helps you to compare an equity fund with select indices and compare with peers.
- Rolling returns comparison with category peers – This tool helps you compare some of the key metrics that are derived from rolling returns data such as proportion of outperformance over peers, average rolling returns, minimum and maximum returns, standard deviation, proportion of losses and so on – with category averages.
Now, let’s discuss using rolling returns meaningfully for your MF analysis. But before that, please note this is an article for those who wish to move from basics to the next level. If you are already a pro, skip this article.
Why use rolling returns
While we have covered rolling returns in detail in our earlier article on various return metrics, it is important to understand why we use rolling returns in analysis. When you look at a 1-,3-, or 5-year returns data, it is from ‘x’ date to ‘y’ date. Anything that happened between these 2 dates will not reflect in the point-to-point or trailing returns.
But when you look at the performance over a period (instead of point in time), you will see a fund’s behaviour. Patterns emerge, like the fund falling more than the market in corrections or rising more in a bull market or a fund’s proportion of losses being lower than peers and so on. So, these patterns help remove the discrepancies of what point-in-time data won’t tell you and gives you a clearer picture of the fund.
(For the uninitiated, imagine this to be a single rendezvous with a girl/boyfriend versus living with them every day!)
It is true that these return patterns only tell you what happened in the past. But just as it is with life, history teaches us something here too. It tells us how funds behaved in different situations, different market conditions, than at just one point. Such information gives you an indicator of what to expect from the fund and how to calibrate it to your own (portfolio’s) risk profile and strategy.
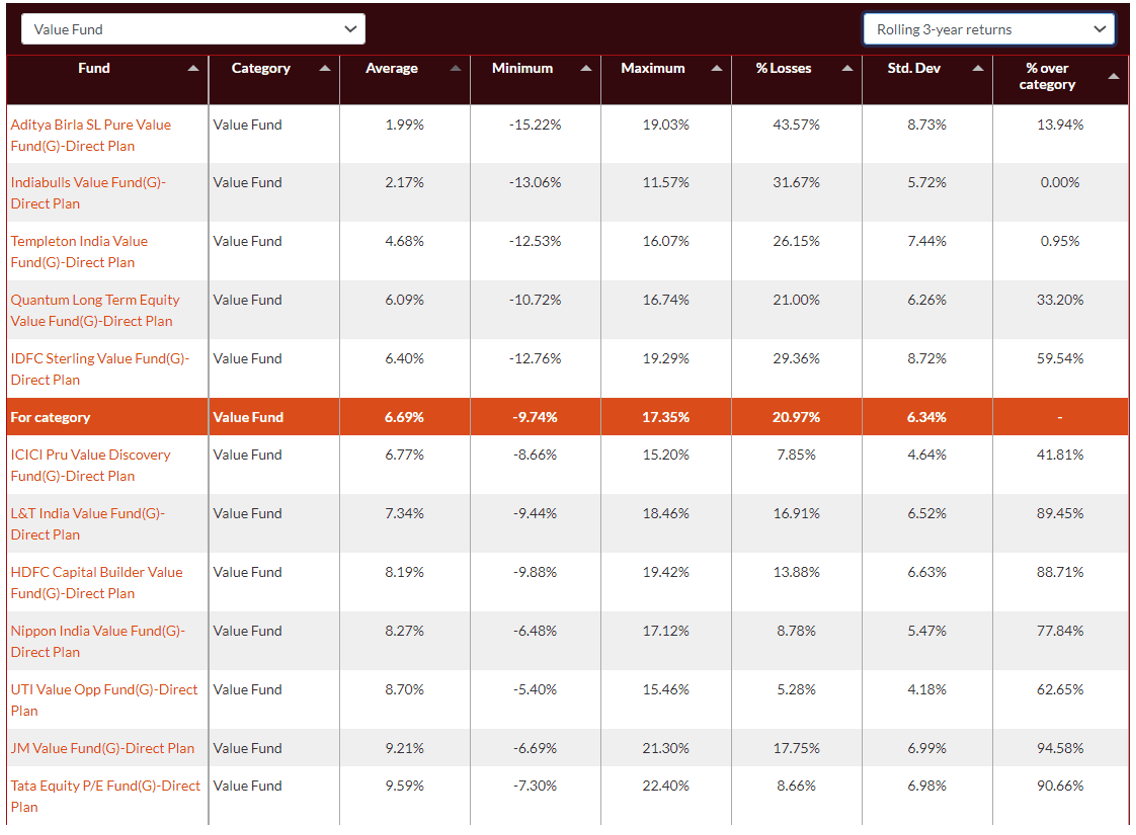
For example, if you went by the top performing funds based on 3-year returns in the large & midcap category, you will see Tata Large & Midcap among the top 3. This may tempt you to just go with it. But data below (taken from our tool) will tell you that had you rolled 3-year returns for a period of 5 years, the fund’s average 3-year return was lower than quite a few peers. You will also see that the % over category – that is the proportion of times it outperformed its category – is not necessarily high. In other words, it was not ‘consistent’ in being at the top.

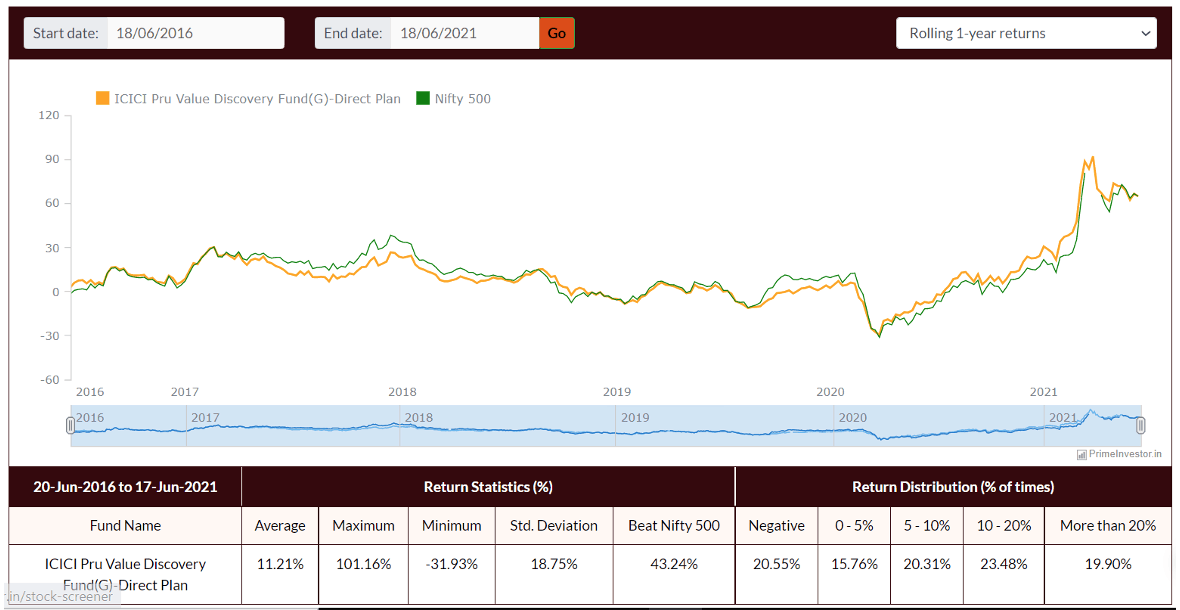
Rolling returns don’t tell you just the past performance. They also tell you about change in trends of a fund’s present performance. This is important from a perspective of knowing whether your fund performance is improving or getting worse. If you own ICICI Pru Value Discovery, the image below will tell you that after a prolonged underperformance, it started beating Nifty 500 from the March 2020 correction. Such changes in performance – for better or worse – can give you cues in your decision to hold them or otherwise, when you review them.
So, to summarize, rolling returns serves three broad purposes:
- It helps measure the consistency in performance in a fund so that you know what to expect from a fund, irrespective of when you enter it.
- It helps derive key metrics that help track a fund’s behaviour – outperformance, volatility, loss proportion and so on. This in turn helps you decide whether it is aggressive or defensive.
- It helps identify changing patterns of performance – when a fund is picking up or it is dipping and whether such trend appears to continue.
The right way to look at rolling return periods
When it comes to looking at rolling returns, the period you choose to roll your returns, how frequently you roll them and the return period itself can make a difference to what you see as an output. This is why you may end up seeing different results in different places. Let us explain what these 3 components are and what is best used in each (there is no right or wrong way here).
#1 Return period
This is simply the returns you want to see rolled – 1 year or 3 years or 5 years and so on. This is the return period you see in point-to-point – but as of today. For example: a regular 1-year return would be point-to-point – returns from a year ago to date. When you do a 1-year rolling return, you will see today’s return a year ago, yesterday’s return a year ago and so on.
What return period you choose will determine how you interpret the data. For example: if you wish to know how consistent an equity fund is, then a 3-year return period might give you a better perspective than say a 6-month period, since equity funds tend to be volatile and inconsistent in the short term. However, if your intent is to see pick up or slide in performance, it may not show up in 3 or 5 year returns soon enough. You might have to look at 6-month or 1-year returns. The earlier example of ICICI Pru Value Discovery (1-year returns) will show such change in performance clearly.
Similarly in debt, when rate cycles are changing, nearer term performance can give you a better picture of how the rate cycle change is impacting performance. In general (this is no thumb rule), with debt funds, shorter periods for shorter duration funds and longer periods for longer duration funds work well.
Also, different metrics might need different periods to be taken sometimes. For example, the proportion of negative returns will be high in 6 month or 1 year period in an equity fund. If you need to know if your fund suffers capital loss over the longer period, then taking a 3- or 5-year return or even 10 years would be a better option to know the ‘point of no loss’.
#2 Length of time over which returns are rolled
This is the period over which you get your data points. For example, in the image above (ICICI Pru Value Discovery) the start date is given as June 18, 2016. That means that the first 1-year return (we have chosen 1 year) will begin on June 18, 2016. That means the first return was taken from June 19, 2015-June 18, 2016. If the returns we had chosen were 3 years, then the first returns period would be June 19, 2013, to June 18, 2016.
This block of ‘from’ and ‘to’ date can be any period. And since markets would have behaved differently in different periods, which block you choose will make a difference.
Let’s take an example to illustrate this. HDFC Flexicap’s (earlier called HDFC Equity) 3-year returns were rolled daily for 10 years (June 2011 to June 2021) and given below. You will see that the fund did well with a 71% outperformance of the benchmark over this period. So, if someone marketing this fund tells you this fund beat the benchmark more than two-thirds of the time, it does sound good.
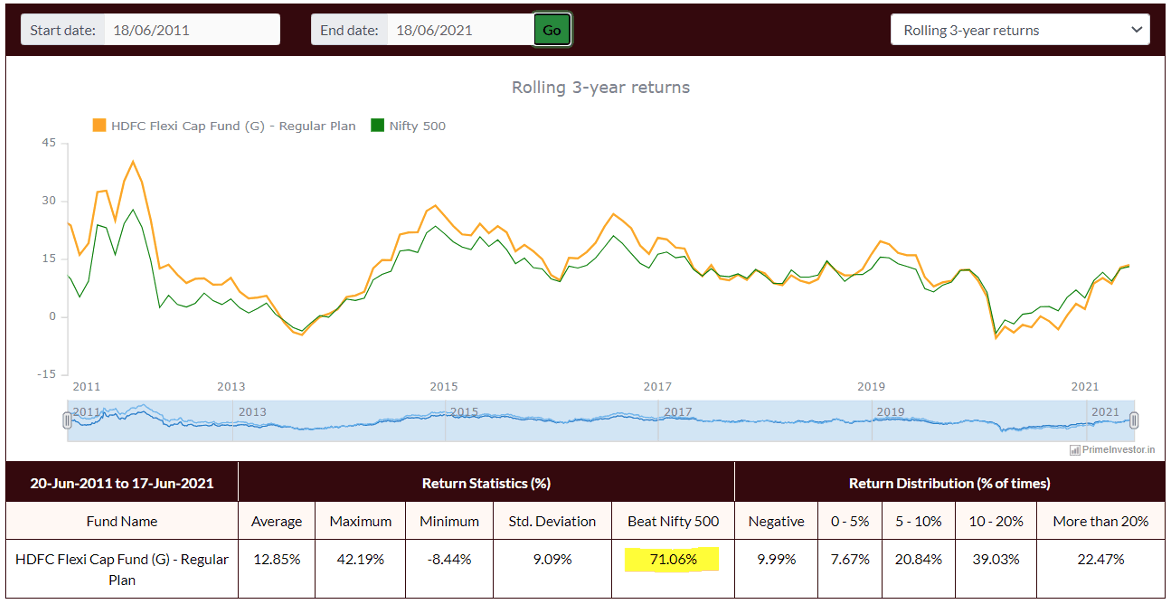
Now, cut the ‘from’ and ‘to’ date to 5 years (June 2016 to June 2021). The table below the graph (image below) will show you that the outperformance proportion fell to just 50%. That means the fund underperformed the benchmark half the time. Depending on which period any data provider/analyst took, the results may turn out to be different.

Now, which period should you then consider? What is more important? That it outperformed long ago or that it has underperformed in more recent times? In the above case, it was important that you knew that the fund was underperforming in recent years.
Therefore, when we do our own internal rating, we give weight to both longer and shorter periods. As we said earlier, shorter periods help bring out any shift in trends. And if such a trend continues for some time, it signals a change, for the better or the worse.
To make it easier for you, in the other tool of PrimeInvestor category-wise rolling return metric comparison, we have taken a standard period of 3 years (for 3 years returns and below) and 5 years (for 5 year returns) of data points. You will be able to choose your period of 6 months or 1 year and so on, but we fixed the 2 & 5-year period (see footnote below the output table) to ensure too much of legacy data does not influence your decision.
#3 Rolling frequency
Rolling frequency is nothing but the frequency with which you are rolling the above return period you chose. For example, it can be rolled every day, every week, every month etc. Needless to say, rolling it every day will have more data points than rolling say over a week or a month. If the length of time (mentioned in point 2) is shorter, it may be better to have more data points – that means you roll data daily. If the length of time is longer – say 10 years or so, then a weekly or monthly frequency is not bad. At PrimeInvestor, our data points are rolled daily to ensure we catch all the daily gyrations of the funds and capture moves better.
How to use our mutual fund rolling returns tools
We have 2 tools, one the rolling returns calculator and the rolling return metrics comparison with category averages.
Rolling returns calculator – uses
- It will help you trace the journey of a fund – in terms of when it underperformed and when it outperformed the index/peer. It also neatly brings out shift in performance – improvements or dips. Sometimes an underperforming fund may be narrowing its gap – that is, the margin of underperformance may be reducing – suggesting that the fund is turning around.
- If you have a specific fund in mind and want to compare with benchmark or with select peers, it will help you with the comparison in terms of the margin of outperformance or underperformance.
- The table right below the graph gives you vital statistics using the average rolling returns for the chosen period, such as minimum and maximum returns, standard deviation in returns and so on. All these terms are explained below the table. Please check the information under the head ‘how to interpret data in the table’. You will also see a useful return distribution data. For example: what proportion of times a fund delivered over 20% returns or what proportion of times it ended with losses. This is an important metric that will also help finetune your return expectation. One small tip here is not to take extended lengths of time (say 15-20 years), since return patterns tend to change with time. The period between 2000 and 2010 saw equity deliver higher than the 2010-2020 period.
Please note a few points in this calculator:
- We have selected equity indices that represent various market caps. They are not strictly every fund or category’s benchmark but will represent the categories well. The Nifty 100 for instance can be used for Largecap, the Nifty 500 for flexi and multi cap and so on.
- We do not have TRI as yet. We will add them if we are able to get the same from our data provider.
- Data for direct plan starts only from 2013.
- With hybrid and debt, we don’t have benchmarks for 2 reasons: most benchmarks used by fund are not accessible as indices from data providers. Two, with debt, as most indices are theoretical (not traded), they’re quite cut off from the reality in terms of liquidity and expenses. Hence, debt is best compared at this juncture with category peers.
Rolling return metrics comparison – uses
- It is a ready tool to gauge fund’s performance on various metrics with the category average.
- In the image above, we have sorted value funds by average rolling 3-year returns. It brings out those funds below and above category average.
- Importantly, it gives you the proportion of outperformance over peers (see last column). This is not a data that is easily available elsewhere. Please note that this info is available only if you are a subscriber.
- It gives you a good idea of the proportion of losses that the fund has suffered in the past, thus letting you know not only the risk, but the time frame needed to avoid such losses.
The content below the table will provide explanations about each of the metrics used.
Note the following with respect to the above tool:
- It is available only for direct plans but acts as a good proxy for regular as well. You can always use the other calculator tool for regular plans.
- The ‘from’ and ‘to’ period – which we call as the length of time for calculating the returns is set at 5 years to make it easy for you to use and keep the data more relevant. That means you will get 5 years of data points whether you choose 1-year, 3 year or 5-year returns. For example: if you choose 1-year rolling returns, it will be data from June 2016-2021. That means the earliest NAV considered will be 2015. If you choose 3-year returns, then data will still be from June 2016-June 2021. But the earliest NAV date for this will be June 2013.
Keep using the tool to help understand fund patterns and returns better. But please avoid making comparisons with our calls in the Review tool or in Prime Funds. For example, if you ask us why a fund has a high average rolling return and still a ‘hold’ in our review tool, we will be unable to take your query. The reason is that our proprietary methodology considers a wide variety of metrics, weighs them based on their importance in each category, looks at trends, and other qualitative factors before arriving at a rating score and call.
For a more comprehensive tool with multiple performance, portfolio and expense metrics, please use our MF SCREENER TOOL.